
Figure A2.
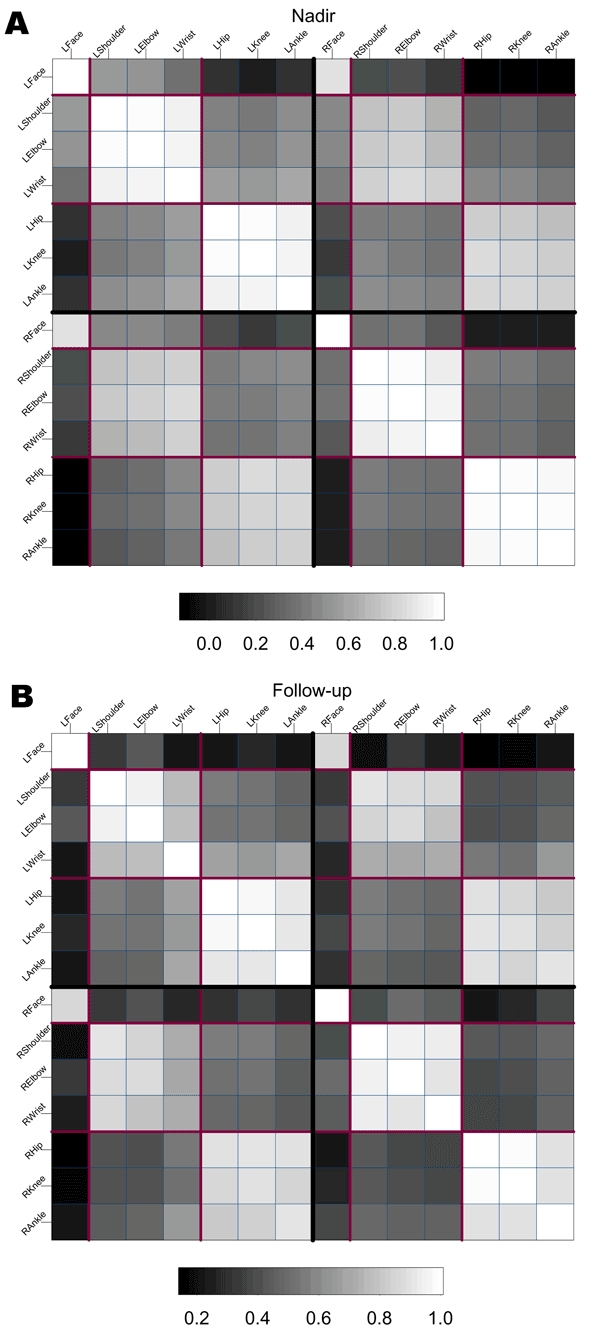
Sample correlation matrices of the 14 strength score measurements at nadir (a) and follow-up (b) for 21 patients with poliomyelitislike syndrome and excluding those who died or were lost to follow-up. Each cell is shaded to represent the correlation between strength scores at the various sites, indicated along the axes, as described and recorded in Figure A1. Darker shading represents lower correlation and white represents perfect (1.0) correlation. The heavy black lines splitting the figure into quadrants separate right and left, and the lighter-shaded lines separate the quadrants into face, arm, and leg measurements. At nadir, consistent correlation is displayed within limbs across the body, with lower correlation between limbs on the same body side; lowest correlation is observed between face and leg. At follow-up, correlations were observed at nadir (e.g., stronger correlation within limbs across body) persist, but associations were weakened somewhat, suggesting greater heterogeneity of strength scores. Weakening of association between distal and proximal limbs suggests distal to proximal improvement. L, left; R, right.