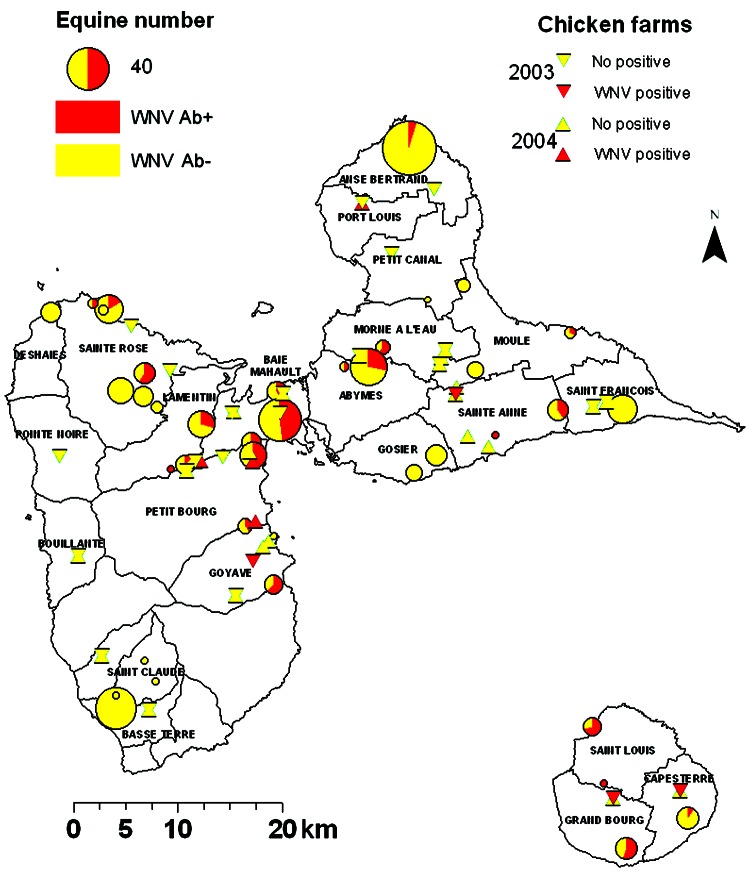
Figure 1.
Results of West Nile virus (WNV) serosurveys in chickens and equines in Guadeloupe, 2003–2004. Equine centers are represented by circles, the sizes of which are proportional to the numbers of equines. The proportion of WNV-seropositive animals is represented in red. Chicken farms are represented by triangles (pointing down for 2003 survey, pointing up for 2004 survey). Red triangles denote farms where at least 1 seropositive chicken was identified. All other farms are denoted by yellow triangles. Ab, antibody.

