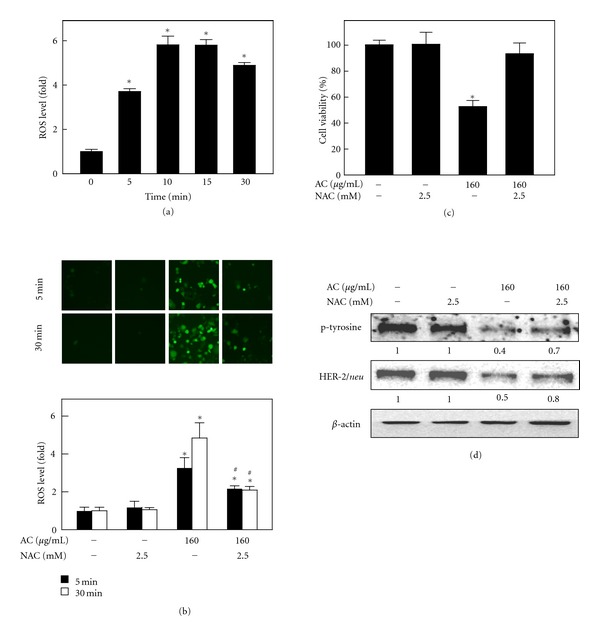
Figure 3.

AC-induced ROS generation and its involvement in cell death. (a) MDA-MB-453 cells were treated with AC (160 μg/mL) for 0, 1, 5, 10, 30, and 60 min. The nonfluorescent cell-membrane-permeable probe DCFH-DA was added to the culture medium at a final concentration of 10 μM for 30 min before the end of each experiment. DCFH-DA penetrated the cells, reacted with cellular ROS, and was metabolized into fluorescent DCF, as indicated by DCF fluorescence, which was measured by fluorescence microscopy (200x magnification). The intracellular ROS level was expressed graphically as a relative fold increase of the control. (b)–(d) MDA-MB-453 cells were pretreated with 2.5 mM NAC, an antioxidant, for 1 h followed by with or without AC (160 μg/mL) treatment and quantified intracellular ROS generation (b), cell viability (c), and HER-2/neu and p-tyrosine protein levels (d). The photomicrographs shown in this figure are from one representative experiment that was performed in triplicate with similar results. Each value is expressed as the mean ± SD (n = 3). ∗,#Significant difference between the control and AC-treated group (P < 0.05).
