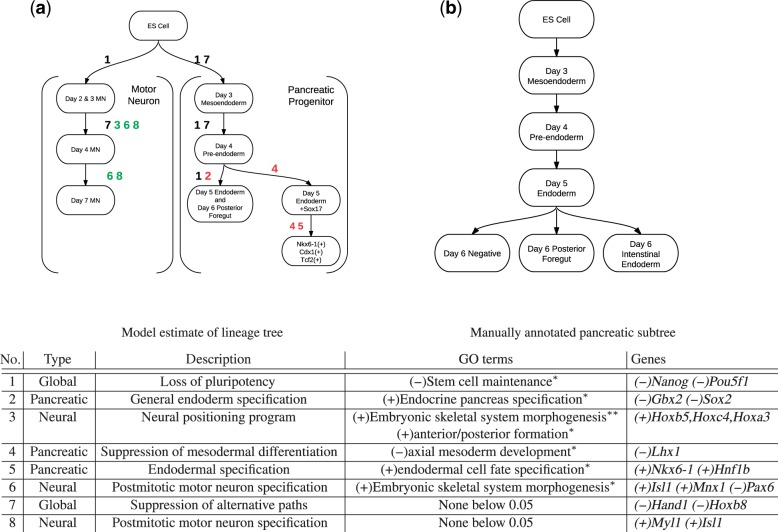
Fig. 8.
(Top) Estimated lineage tree for motor neuron and pancreatic progenitor; nodes are grouped by cell type and edges are labeled by program involved; color indicates program type (see table below) (Bottom) Major GO terms and Genes corresponding to developmental programs stars denote Benjamini–Hochberg corrected P-value of enrichment t-test; *P>0.05;**P>0.01

