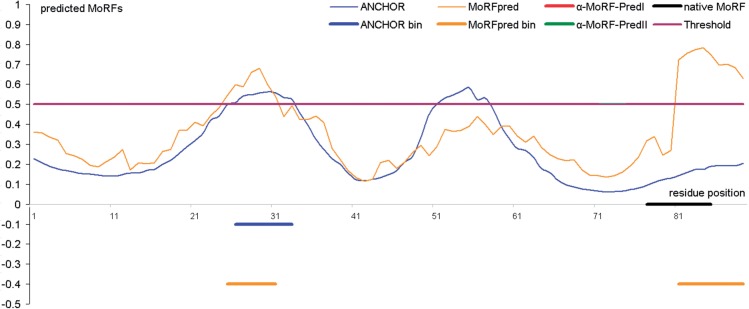
Fig. 4.
Prediction of MoRF residues for the Histone H2A protein by ANCHOR (blue lines), MoRFpred (orange lines), α-MoRF−PredI (thick red line) and α-MoRF-PredI I (thick green line) predictors. The x-axis shows positions in the protein sequence. Probability values are only available for ANCHOR and MoRFpred and are shown by thin blue and orange lines, respectively, at the top of the figure. The cutoff of 0.5 to convert probabilities into binary predictions for ANCHOR and MoRFpred is shown using a brown horizontal line. The native MoRF regions are annotated using black horizontal line. The binary predictions from ANCHOR, α-MoRF−PredI, α-MoRF-PredI I and MoRFpred are denoted using blue (at the −0.1 point on the y-axis), red (at the −0.2), green (at the −0.3) and orange (at the −0.4) horizontal lines. Lack of red and green lines means that α-MoRF−PredI and α-MoRF-PredII did not predict MoRFs

