
Fig. 6.
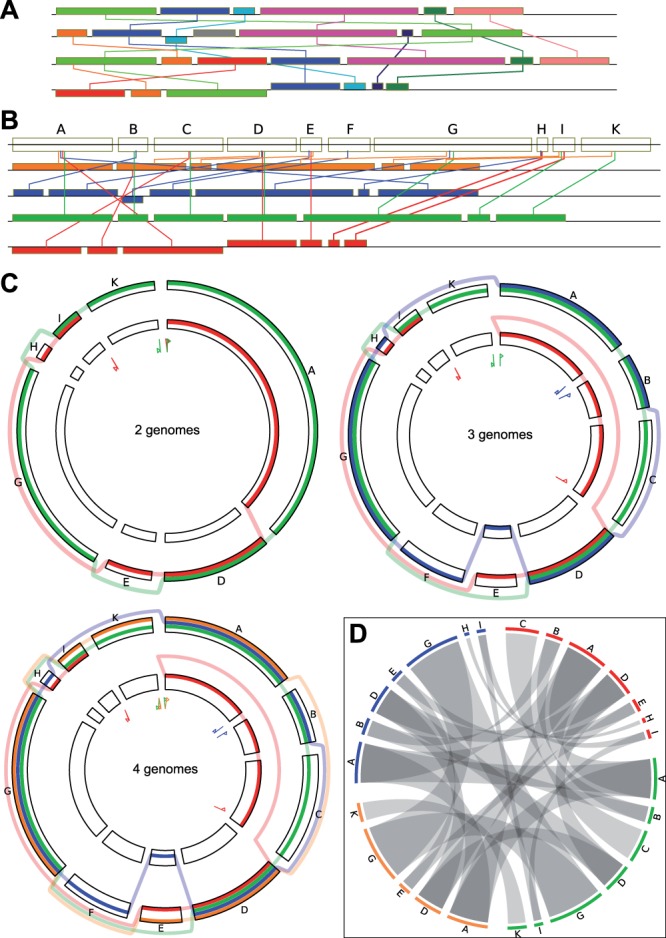
Linear versus circular view. An alignment of four genomes is shown. (A) block-based display in the style of Mauve (Darling et al., 2004) using colors to distinguish blocks and edges to link identical blocks in the aligned genomes. (B) linear representation of the SuperGenome for this example, using one color for each genome. (C) circular GenomeRing visualization of the same example, built step-by-step from the alignment, starting with two genomes. The inversion and deletion events accounting for the differences between the two genomes are very clearly visible. The third genome gives rise to new blocks by its new start/end coordinates, by a deletion (new blocks A–C), and by an insertion (new block F). The addition of the fourth, orange, genome does not induce the formation of any more blocks, but simply adds a new path. The increase in visual complexity is quite small when compared with the linear views. (D) visualization of the same alignment using Circos. Aligned blocks are connected