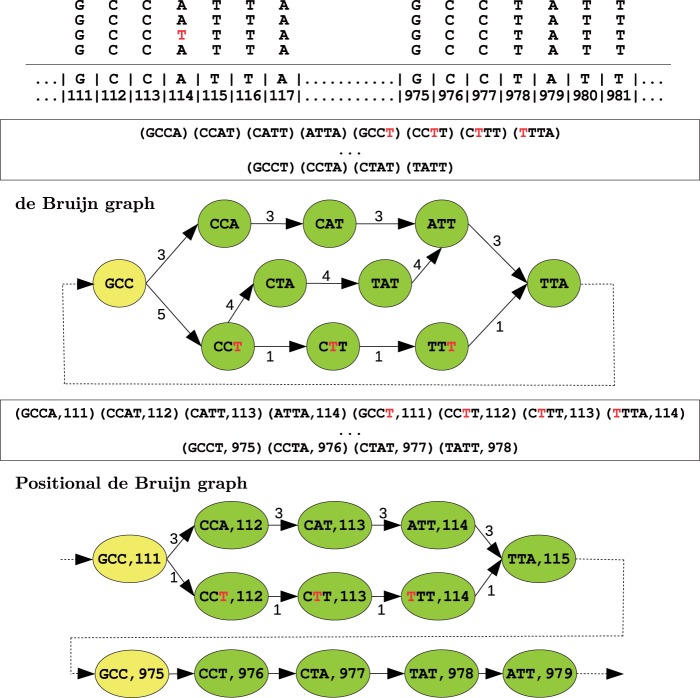
Fig. 2.
An example illustrating the positional de Bruijn graph (k=4, Δ=1) and de Bruijn graph on a set of aligned reads, with their corresponding sets of k-mers and positional k-mers. There exists a single sequencing error in the reads (shown in red). In the de Bruijn graph, the (k − 1)-mer GCC appears as a single vertex, whereas, the positional de Bruijn graph separates the occurrence of GCC into two vertices. This additional information incorporated into the graph further constraints the gluing process and reduces complexity. Further, the positional k-mers (GCCT, 111) and (GCCT,975) have multiplicity 1 and 4, respectively, but the k-mer GCCT has multiplicity 5. This increases the weight of the incorrect path, and thus the likelihood of an error in the contig produced by the de Bruijn graph. Lastly, we note that in this example no vertex gluing operations occur but in more complex instances, vertex gluing will occur when equal k-mers align at adjacent positions

