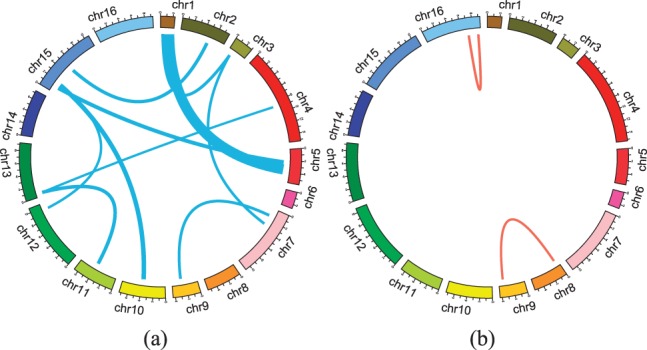
Fig. 3.

Hotspots of SNP pairs with epistatic effects identified by (a) our method and (b) two-locus epistasis test. This figure represents the yeast genome in a circular format generated using Circos software (Krzywinski et al., 2009). In clockwise direction, from the top of the circles, we show 16 chromosomes. Lines indicate interaction effects between two connected locations in the genome. Thickness of the lines is proportional to the number of traits affected by the interaction effects. Here we show interaction effects which influence > 100 gene traits. The hotspots for (a) are shown in Table 1. In (b), two SNP pairs are found including chr16:718892-chr16:890898 (affected genes are enriched with the GO category of ribosome biogenesis with corrected P-value 1.6×10−36), and chr8:56246-chr9:362631 (affected genes are enriched with the GO category of vacuolar protein catabolic process with corrected P-value 1.6×10⁻¹⁴)
