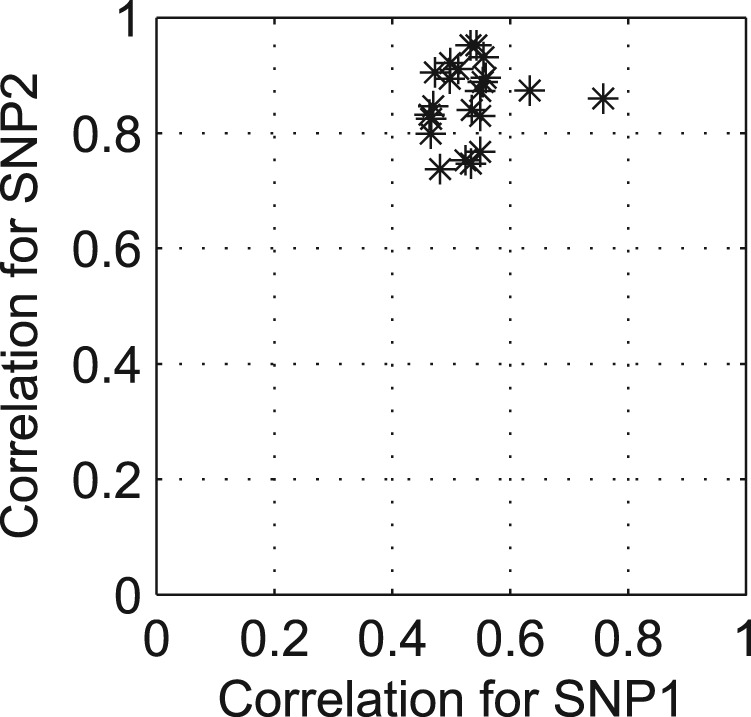
Fig. 6.

The scatter plot for illustrating the correlations between the SNP pair at hotspot 1 (SNP1, SNP2) and SNP pairs detected by two-locus epistasis test (P-value <10−6) close to hotspot 1 (within <50 kb). Each dot represents a SNP pair found by two-locus epistasis test, and it was perturbed by a small amount of random noise to avoid overlapping dots
