
Fig. 4.
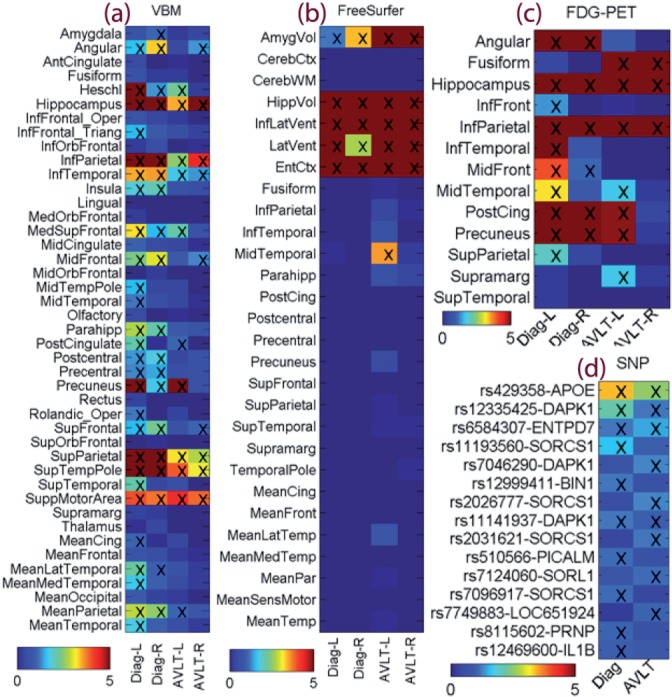
Weight maps for multimodal data: (a) VBM measures from MRI, (b) FreeSurfer measures from MRI, (c) glucose metabolism from FDG-PET, and (d) top SNP findings. Weights for disease classification were labeled as Diag-L (left side), Diag-R (right side) or Diag; and weights for RAVLT regression were labeled as AVLT-L, AVLT-R or AVLT. In (a–c), weights were normalized by dividing the corresponding threshold used for feature selection, and thus all selected features had normalized weights ≥1 and were marked with ‘x’. In (d), only top SNPs were shown, weights were normalized by dividing the weight of the 10th top SNP, and the top 10 SNPs for either classification or regression task had normalized weights ≥1 and were marked with ‘x’