
Fig. 1.
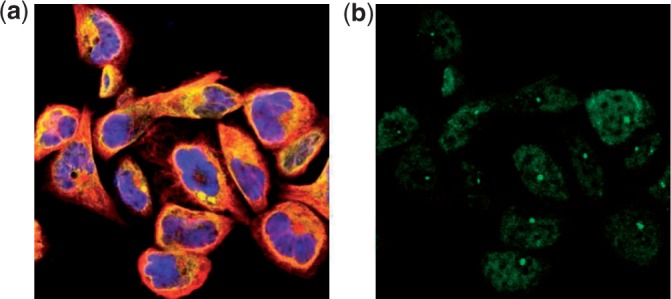
One sample image from the HPA data set. The (a) shows the three reference channels reflecting different components (blue:nucleus, yellow:ER and red:cytoskeleton). The (b) shows the channel of the stained protein (green)
Official websites use .gov
A
.gov website belongs to an official
government organization in the United States.
Secure .gov websites use HTTPS
A lock (
) or https:// means you've safely
connected to the .gov website. Share sensitive
information only on official, secure websites.
One sample image from the HPA data set. The (a) shows the three reference channels reflecting different components (blue:nucleus, yellow:ER and red:cytoskeleton). The (b) shows the channel of the stained protein (green)