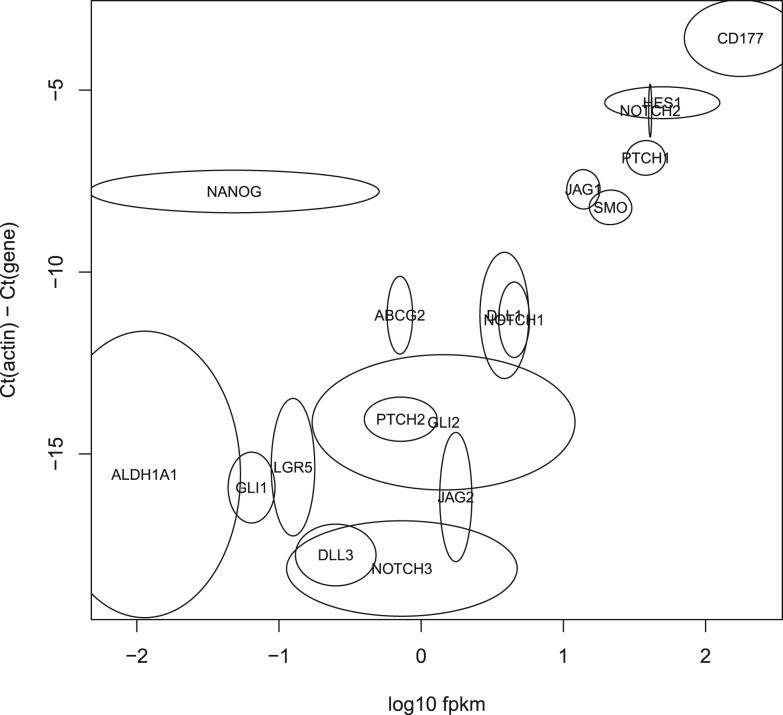
Fig. 5.
Validation of the in silico classification of xenograft RNA-Seq data with qRT-PCR. The horizontal axis shows log10FPKM for the Xenome-derived gene expression for the 18 test genes. The vertical axis shows the Ct value for each gene relative to the Ct of actin. There were two RNA-Seq samples processed (biological replicates), and four replicates of the qRT-PCR. For each gene, an ellipse is shown centered on the mean log10FPKM in the x-axis, and on the mean relative Ct in the y-axis. The horizontal and vertical radii show the variance in the samples

