Figure 10.
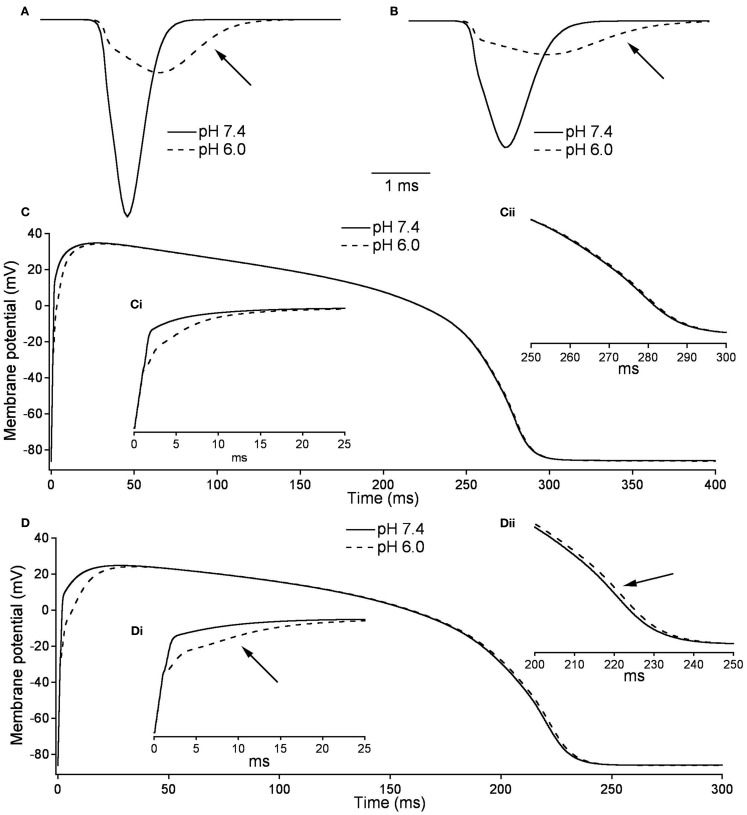
Effects of pH on cardiac action potential. (A) The fast sodium current of a cardiac AP at pH 7.4 (solid line) and pH 6.0 (dashed line). The sodium current is recorded on the 15th AP in an endocardial myocyte stimulated at a frequency of 2.5 Hz. (B) The fast sodium current of a cardiac AP at pH 7.4 (solid line) and pH 6.0 (dashed line). The sodium current is recorded on the 200th AP in a endocardial myocyte stimulated at a frequency of 3.33 Hz. (C) The membrane potential over the time of one endocardial myocyte AP with sodium currents at pH 7.4 (solid line) and pH 6.0 (dashed line). The AP is the 15th produced in a model ventricular endocardial myocyte stimulated at 2.5 Hz. (Ci) The first 25 ms of the 15th endocardial AP stimulated at 2.5 Hz with sodium currents at pH 7.4 (solid line) and pH 6.0 (dashed line). (Cii) The last 50 ms of the 15th endocardial AP stimulated at 2.5 Hz with sodium currents at pH 7.4 (solid line) and pH 6.0 (dashed line). (D) The membrane potential over the time of one endocardial myocyte AP with sodium currents at pH 7.4 (solid line) and pH 6.0 (dashed line). The AP is the 200th produced in a model ventricular endocardial myocyte stimulated at 3.33 Hz. (Di) The first 25ms of the 200th endocardial AP stimulated at 3.33 Hz with sodium currents at pH 7.4 (solid line) and pH 6.0 (dashed line). (Dii) The last 50 ms of the 200th endocardial AP stimulated at 3.33 Hz with sodium currents at pH 7.4 (solid line) and pH 6.0 (dashed line).

