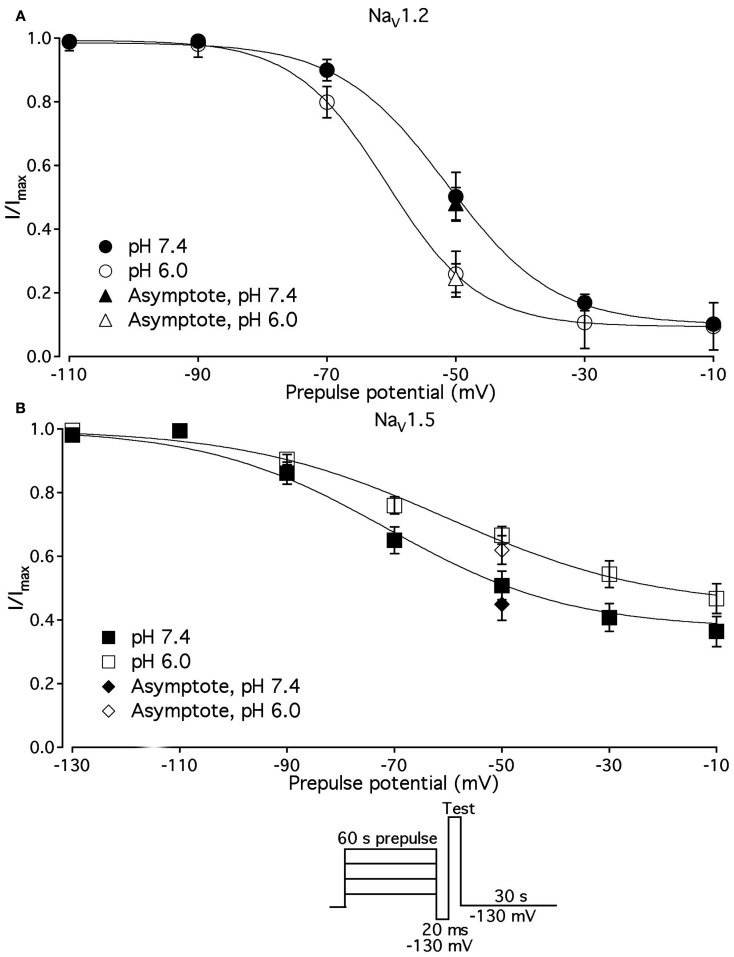
Figure 6.
Low pH alters properties of slow inactivation in NaV1.2 and in NaV1.5. (A) Steady-state slow inactivation in NaV1.2 at pH 7.4 (filled circles) and at pH 6.0 (open circles) is plotted as averaged normalized current amplitude vs. 60-s prepulse voltage. Asymptotic values for NaV1.2 derived from double exponential fit to slow inactivation onset (B) at pH 7.4 (filled triangles) and at pH 6.0 (open triangles) are superimposed with steady-state slow inactivation data at corresponding prepulse voltage (−50 mV). (B) Steady-state slow inactivation in NaV1.5 at pH 7.4 (filled squares) and at pH 6.0 (open squares) is plotted as averaged normalized current amplitudes vs. 60-s prepulse voltage. Asymptotic values for NaV1.5 derived from double exponential fits to slow inactivation onset (B) at pH 7.4 (filled triangles) and at pH 6.0 (open triangles) are superimposed with steady-state slow inactivation data at corresponding prepulse voltage (−50 mV). Data were obtained with pulse protocol shown in (B) inset and fit with a modified Boltzmann function (Eq. 6, Material and Methods). Data represent mean ± SEM (n = 7–10).

