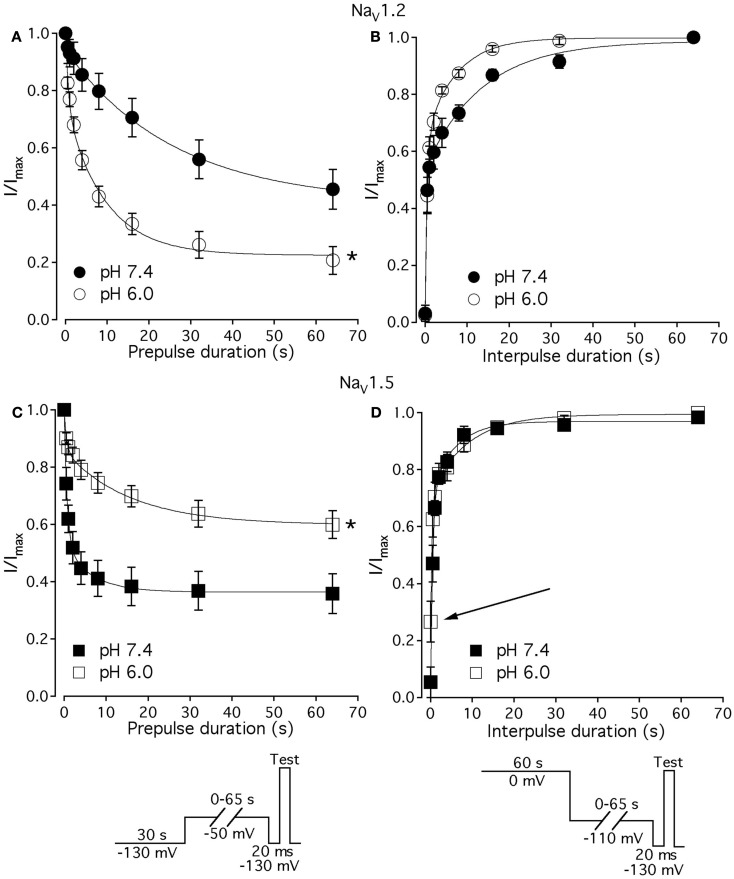
Figure 7.
Low pH alters kinetics of slow inactivation in NaV1.2 and in NaV1.5. (A) The time course of slow inactivation onset in NaV1.2 at pH 7.4 (filled circles) and at pH 6.0 (open circles) is plotted vs. prepulse voltage as averaged and normalized currents, obtained with pulse protocol shown in (C) inset. (B) The time course of recovery from slow inactivation in NaV1.2 at pH 7.4 (filled circles) and at pH 6.0 (open circles) is plotted vs. interpulse voltage as averaged and normalized currents, obtained with pulse protocol in (D) inset. (C) The time course of slow inactivation onset in NaV1.5 at pH 7.4 (filled squares) and at pH 6.0 (open squares). (D) The time course of recovery from slow inactivation in NaV1.5 at pH 7.4 (filled squares) and at pH 6.0 (open squares). Data represent mean ± SEM (n = 7–10). Asterisks denote statistical difference (p < 0.05).

