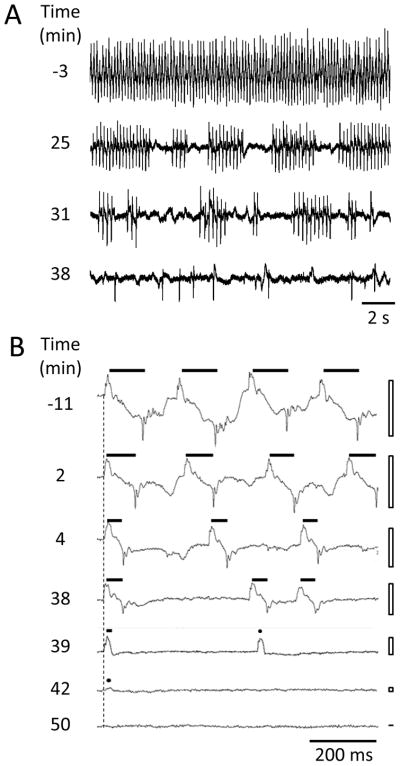
Figure 4.
Changes in EPG waveform and frequency during ivermectin treatment. A and B each show representative recordings from a single wild type worm at the times indicated at left, relative to the switch from control solution to ivermectin (designated 0 min). Vertical gain (voltage) is the same for all traces within a panel. A. Changes in action potential timing and amplitude. This worm was tailfirst in the channel so E spikes are downward in the Figure. B. Changes in EPG waveform. This worm was headfirst in the channel and EPG traces are aligned (vertical dashed line) by the onset of a positive E spike, except for the bottom trace which occurred after EPG activity ended. The ivermectin concentration was 10 μM. Filled bars show E-to-R duration for each action potential waveform; filled circles indicate action potentials waveforms with an E but no R spike; open bars indicate voltage excursion of EPG waveforms in in the adjoining trace.

