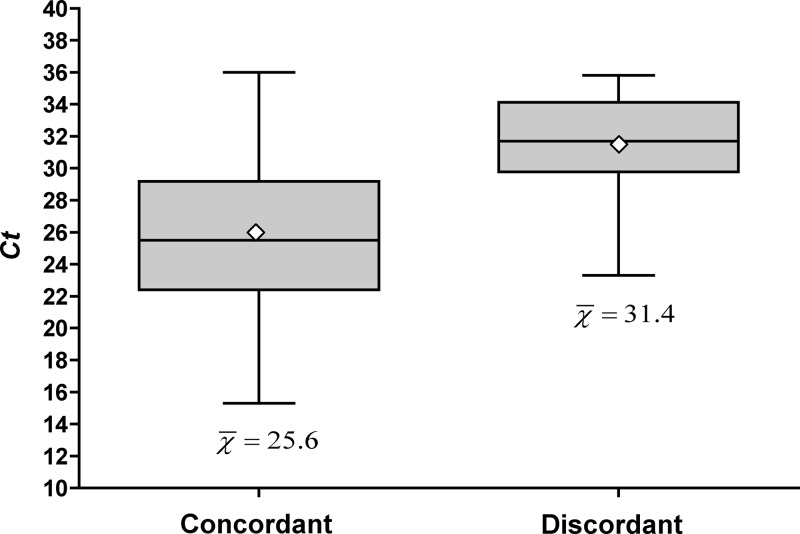
Fig 1.
Box plot of cycle thresholds (Xpert MRSA assay) among patients with a positive Xpert nasal screen and simultaneous positive direct agar screen (concordant) and those with a positive Xpert nasal screen and a simultaneous negative direct agar screen (discordant). The shaded boxes represent the 25th percentile to the 75th percentile. The central horizontal line represents the 50th percentile, and vertical lines represent the maximum and minimum values. The open diamond reflects the mean. t test for comparing two means, P = <0.005.

