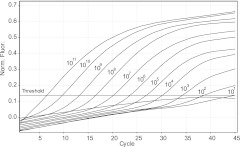
Fig 1.
Typical real-time amplification plot generated from a 10-fold dilution series of the short RNA HDV-1 standard. From left to right, the curves represent 2.7 × 10¹¹ to 2.7 × 101 HDV RNA copies/reaction. The curve that stayed below the threshold corresponds to 2.7 copies/reaction. Norm. Fluor., normalized fluorescence.

