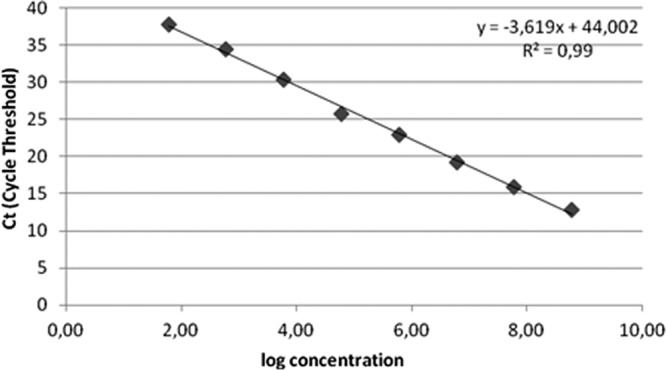
Fig 1.

HIV real-time PCR plasmid integrase standard curve, showing linearity over a range of 8 orders of magnitude. The least-squares regression was calculated from plots of values measured for cycle threshold (Ct) (y axis) versus input plasmid DNA over a range of 101 to 108/ml (x axis) tested in duplicate PCR wells per dilution. The correlation coefficient was 0.99, and the slope of the line was −3.6.
