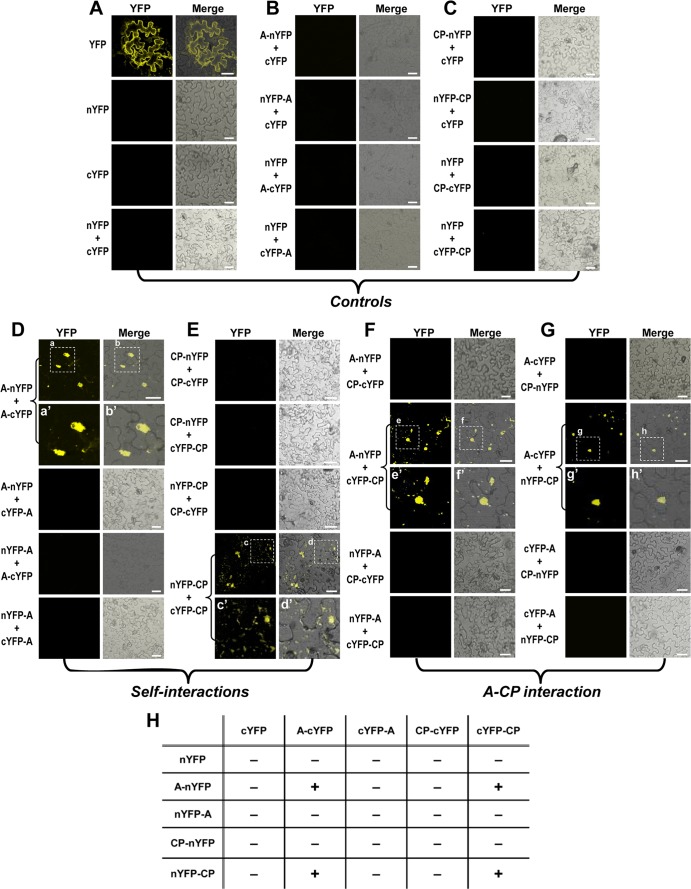
Fig 2.
Visualization in vivo of protein A and CP interactions. Each binary construct was transformed into Agrobacterium strain GV3103 and infiltrated into the abaxial side of N. benthamiana leaves in either single or pairwise combinations, as indicated on the left side of each panel. The reconstructed YFP signals were observed in the epidermal cells using confocal microscopy at 3 days postinfiltration (dpi). Representative confocal fluorescence images shown. (A to C) Three sets of control samples. (D and E) Self-interaction of protein A and CP. (F and G) Protein A-CP interactions. Fluorescent signals from expression of YFP (in panel A) represent a positive control. Subcellular images for fluorescence emitted by YFP and the merged images under the transmitted-light mode are shown. Images a′, b′, c′, d′, e′, f′, g′, and h′, in either single or pairwise combinations, are enlargements that correspond to the areas indicated in panels a, b, c, d, e, f, g, and h, respectively. The fluorescence signals were observed in the epidermal cells using confocal microscopy at 3 dpi. Bar, 30 μm. (H) Summary of self- and cross-interactions. The presence or absence of yellow fluorescence was indicated by “+” and “−” symbols, respectively.

