Fig 1.
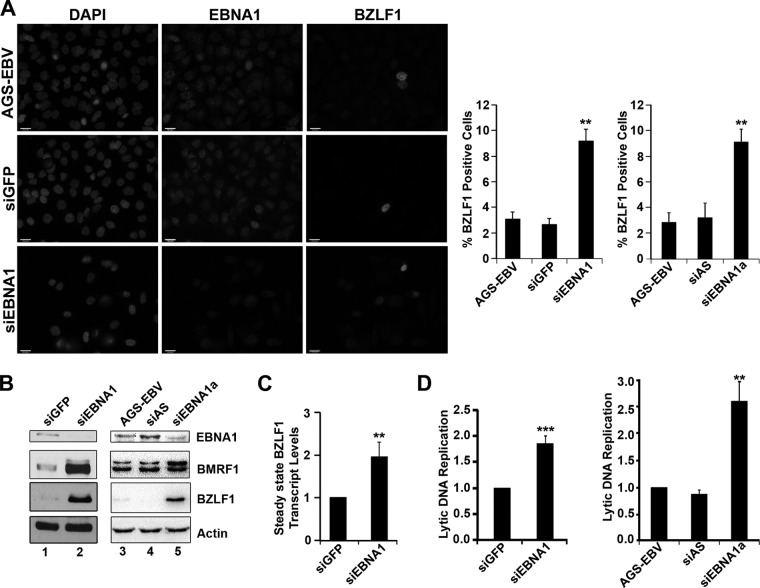
EBNA1 expression inhibits spontaneous EBV reactivation. AGS-EBV cells were treated with siRNA against GFP (siGFP) or EBNA1 (siEBNA1) or left untreated (AGS-EBV). (A) Cells were fixed and stained with antibodies against EBNA1 (middle panels) and BZLF1 (right panels), and the percentage of BZLF1-positive cells was determined, where more than 100 cells were counted under each condition. Images with the same antibody treatment were captured using the same exposure times. The bar graph shows average values from three separate experiments with standard deviations. The bar graph on the right shows results using an alternative siRNA against EBNA1 (siEBNA1a) and AllStars negative-control siRNA (siAS). **, P value < 0.01. (B) Equal amounts of cell lysates from untreated AGS-EBV (lane 3) or AGS-EBV treated with siGFP, siEBNA1, siEBNA1a, or AllStars siRNA (siAS) were compared by Western blotting using antibodies for EBNA1, BMRF1, BZLF1, and actin (loading control). (C) Steady-state transcript levels of BZLF1 were monitored by isolating total RNA, synthesizing cDNA, and quantifying transcript levels using primers specific to BZLF1. Values were normalized to the GAPDH housekeeping gene. Average levels of the BZLF1 transcript from three separate experiments are shown for siEBNA1 treatment (with standard deviations) relative to those for the siGFP treatment (set to 1). (D) EBV genomic DNA was quantified by isolating total DNA, amplifying the EBV DS sequence, and normalizing to GAPDH. Average levels (with standard deviations) for siEBNA1 treatment were compared to those for siGFP treatment (set to 1; left graph), and results for siEBNA1a and siAllStars treatment was compared to results for untreated AGS-EBV (set to 1; left panel). ***, P < 0.001.

