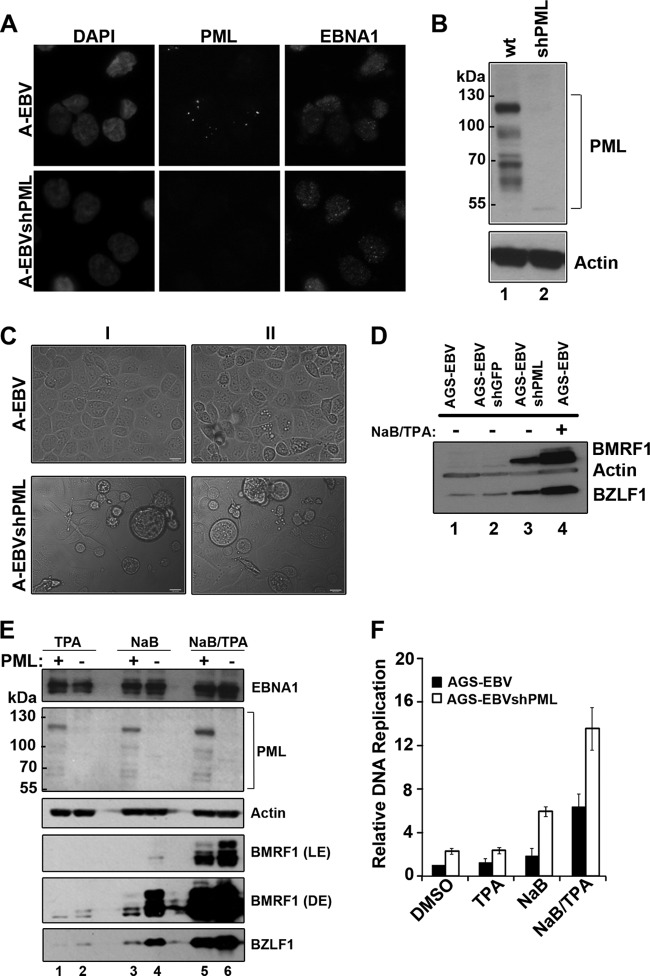
Fig 4.
PML represses EBV reactivation. AGS-EBV (A-EBV) cells were infected with a lentivirus carrying shRNA against all PML isoforms and were selected for cells containing the lentivirus to generate AGS-EBVshPML cells (A-EBVshPML). (A) Cells were fixed and stained with antibodies against EBNA1 (right panels) and PML (middle panels). Images with the same antibody treatment were captured using the same exposure times. (B) Equal amounts of cell lysates from AGS-EBV (wt) and AGS-EBVshPML (shPML) were compared by Western blotting using an antibody that recognized all isoforms of PML or actin (loading control). (C) Light microscopy images of AGS-EBV and AGS-EBVshPML cells from two experiments (I and II). Examples of enlarged, rounded cells in the AGS-shPML cells are seen in the bottom panels. (D) Equal amounts of cell lysates from AGS-EBV (before and after NaB-TPA treatment) and AGS-EBVshPML (no NaB-TPA treatment) were compared by Western blotting using antibodies that recognize BMRF1, BZLF1, and actin. Lysates from AGS-EBV cells containing a negative-control lentivirus expressing shGFP are also shown (AGS-EBVshGFP, lane 2, no NaB-TPA treatment). (E) Equal amounts of cell lysates from AGS-EBV (PML+) and AGS-EBVshPML (PML−) were compared post-treatment with NaB, TPA, and NaB-TPA by Western blotting using antibodies against PML (all isoforms), EBNA1, BMRF1, BZLF1, and actin. Light (LE) and dark (DE) exposures of the same blot are shown for BMRF1. (F) EBV genomic DNA was quantified post-treatment with DMSO, NaB, TPA, or NaB-TPA as described for Fig. 1D. Average levels with standard deviations after each treatment are shown; values were normalized to AGS-EBV cells treated with DMSO (set to 1).

