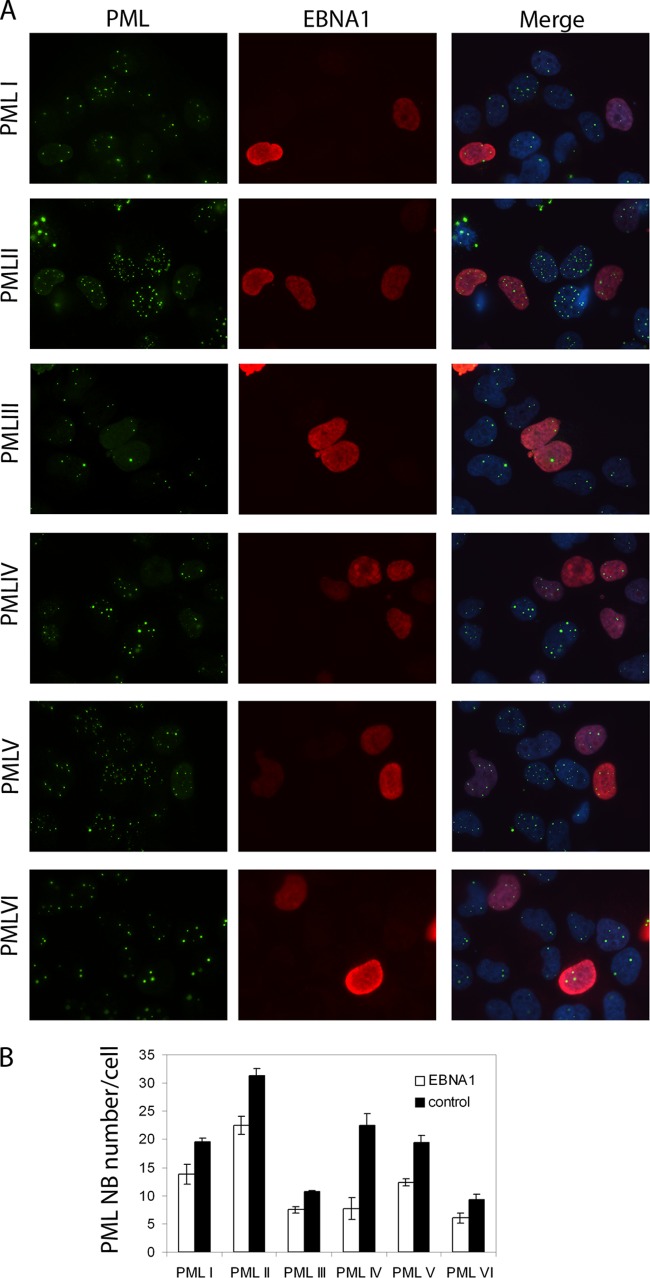
Fig 7.
EBNA1 preferentially disrupts PML NBs formed by PML IV. CNE2 cells expressing single PML isoforms I to VI were generated as in the work of Sarkari et al. (55) and were transfected with an EBNA1 expression plasmid. (A) Cells were stained with antibodies against PML (green) and EBNA1 (red) and visualized by IF microscopy. These images were also merged with a DAPI counterstain (right panels). (B) The number of PML NBs per cell was counted for EBNA1-positive cells 48 h after EBNA1 transfection (white bars) and EBNA1-negative cells (control; black bars), and average values from three independent experiments (with standard deviations) are shown.

