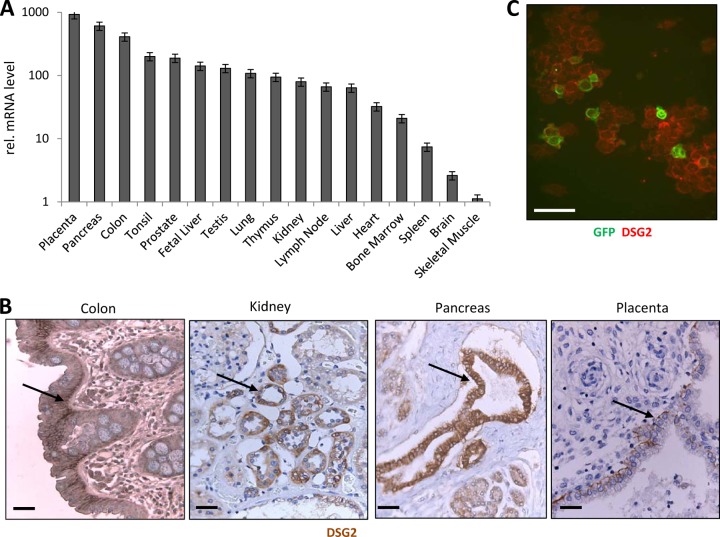
Fig 1.
DSG2 expression in human tissues. (A) DSG2 mRNA expression. qRT-PCR was performed on MTC cDNA panels from Clontech. These panels are fully normalized to the mRNA expression levels of four housekeeping genes (α-tubulin, β-actin, GAPDH, and phospholipase A2). Shown are relative DSG2 mRNA levels. DSG2 PCR signal intensity of different tissues was compared to that of skeletal muscle (the tissue with the lowest DSG2 expression level). n = 3 (technical replicates). (B) DSG2 immunohistochemistry of human tissue paraffin sections. DSG2 appears in brown. Sections are counterstained with hematoxylin. Representative sections are shown. Scale bars, 20 μm. DSG2 signals in epithelial layers are marked by arrows. (C) Immunofluorescence analysis of GFP (green) and DSG2 (red) of human CD34+ cells. Scale bar, 20 μm.

