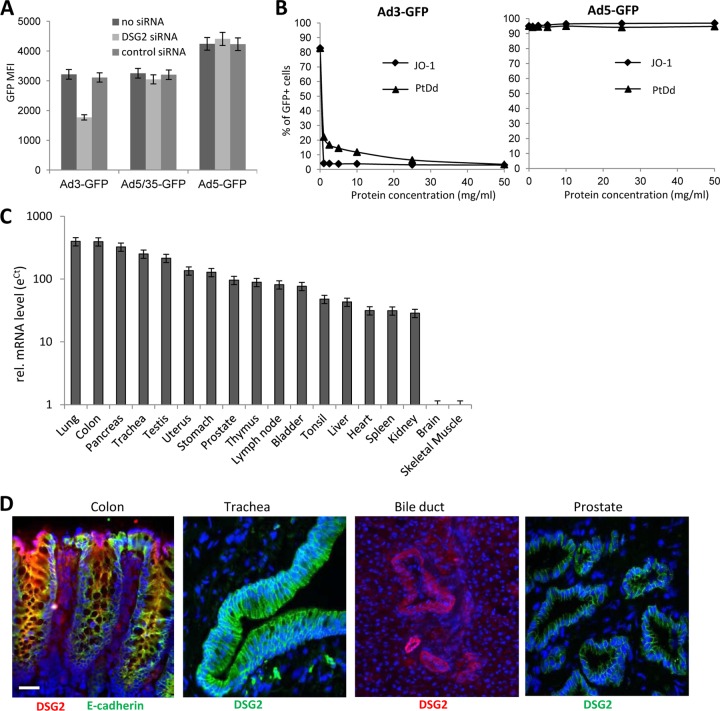
Fig 2.
Ad3 transduction of monkey cells and DSG2 expression in tissues of Macaca fascicularis. (A and B) Transduction studies in green monkey Vero cells. (A) siRNA knockdown of monkey DSG2 expression. Vero cells were transfected with monkey DSG2-siRNA or control siRNA and, 48 h later, infected with Ad3-GFP, Ad5/35-GFP, or Ad5-GFP vector. GFP expression was analyzed 18 h after infection. (B) Vero cells were incubated at increasing concentrations of the DSG2 ligands JO-1 or Ad3 penton-dodecahedra (PtDd) for 1 h and then infected with 100 PFU/cell of Ad3-GFP or Ad5-GFP virus. Shown is the percentage of GFP-expressing cells measured 18 h after infection. (C) Monkey DSG2 mRNA expression. Total RNA was isolated and reverse transcribed, and qRT-PCR was performed. Shown are relative DSG2 mRNA levels. ΔCT values were normalized for GAPDH expression, and the log eΔCT was used to compare DSG2 mRNA levels between tissues, in which the value for skeletal muscle was taken as 1. n = 3 (technical replicates). (D) Monkey DSG2 immunofluorescence analysis of macaque tissue. The colon section is also costained for E-cadherin. Representative sections are shown. Scale bar, 20 μm.

