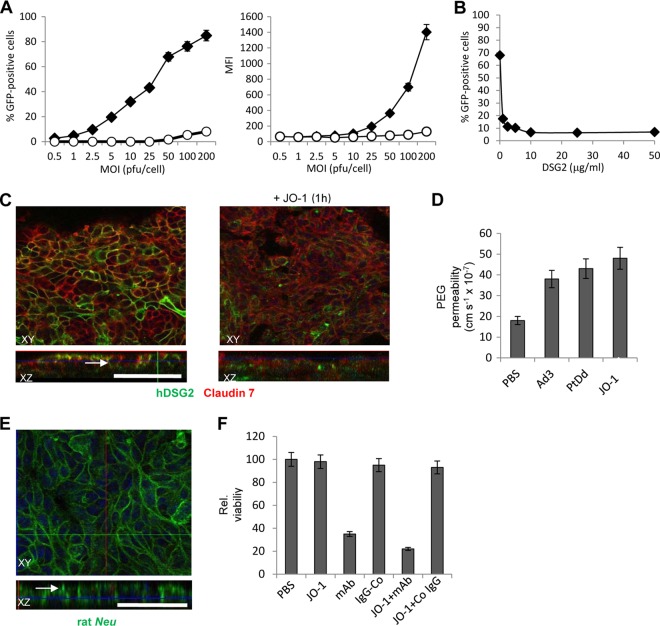
Fig 3.
Function of human DSG2 in mouse mammary carcinoma cells expressing human DSG2 after lentivirus gene transfer (MMC-hDSG2 cells). (A) Transduction of MMC cells (empty circles) and MMC-hDSG2 cells (black diamonds) by Ad3-GFP at increasing MOIs. The percentage of GFP-expressing cells and mean fluorescence intensity (MFI) were analyzed 18 h after infection. n = 3. (B) Competition of Ad3-GFP infection by recombinant, soluble hDSG2. MMC-hDSG2 cells were incubated with increasing concentrations of hDSG2 for 60 min before being infected with Ad3-GFP vectors at an MOI of 100 PFU/cell for 60 min, after which the viruses were removed and new medium was added. GFP fluorescence was measured 18 h later. n = 3. Shown are average values. The standard deviation was less than 10% for all samples. (C) Confocal immunofluorescence microscopy of MMC-hDSG2 cells before and 12 h after exposure to 0.5 μg/ml of JO-1. Scale bar, 40 μm. The white arrow in the XZ panel indicates an area with junction-localized DSG2. (D) 14C-PEG-4000 diffusion through monolayers of MMC-hDSG2 cells at 30 min after adding inactivated Ad3 virions (Ad3) (2 × 10⁸ particles/ml), Ad3 penton-dodecahedra (PtDd) (0.5 μg/ml), or JO-1 (0.5 μg/ml). n = 5. (E) Confocal immunofluorescence microscopy of MMC-hDSG2 cells. Rat Neu (green) appears to be trapped in junctions (see white arrow). (F) JO-1 enhances killing of MMC-hDSG2 cells by the Neu-specific monoclonal antibody 7.16.4-MAb. MMC-hDSG2 cells were incubated with 0.5 μg/ml JO-1 or PBS followed by 7.16.4-MAb (mAb) or control antibody (IgG-Co) 12 h later. Viability was measured 4 days later. Viability of PBS treated cells was taken as 100%, n = 5. P < 0.05 for mAb versus JO-1+MAb.

