Fig 5.
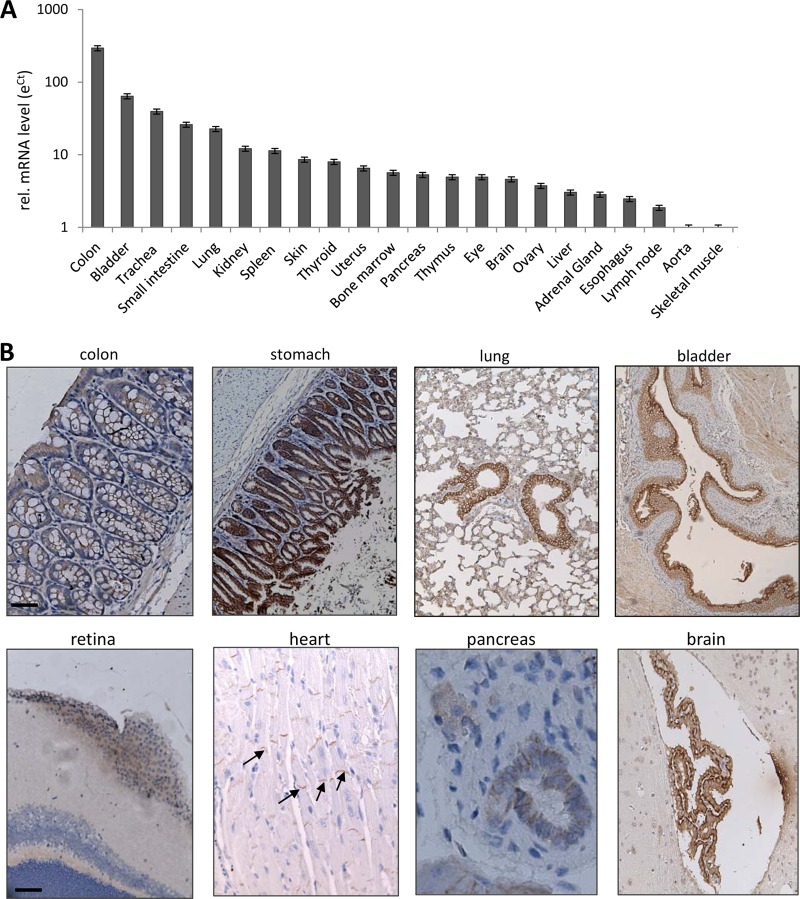
hDSG2 expression in tissues of hDSG2-transgenic mice. (A) hDSG2 mRNA expression. Total RNA was isolated and reverse transcribed, and qRT-PCR was performed. Shown are relative hDSG2 mRNA levels. The eΔCT value of skeletal muscle was taken as 1. n = 3 (different animals). Notably, hDSG2 mRNA background signals in nontransgenic littermates were below the levels in skeletal muscle of hDSG2-transgenic mice. (B) hDSG2 immunohistochemistry analysis of paraffin sections. hDSG2 appears in brown. Sections are counterstained with hematoxylin. Representative sections are shown. Scale bars, 20 μm. Examples of hDSG2 staining in intercalated discs in the myocardium are labeled by arrows.

