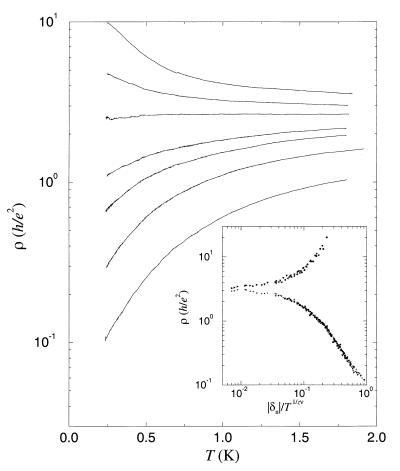
Figure 1.
Resistivity (ρ) vs. temperature for 2D electrons in silicon in zero magnetic field and at different electron densities (n) (from top to bottom: 0.86, 0.88, 0.90, 0.93, 0.95, 0.99, and 1.10 × 10¹¹ per cm2. Collapse of the data onto two distinct scaling curves above and below the critical transition density (nc) is shown in the Inset. Here δ = (n − nc)/nc, z = 0.8, and ν = 1.5.

