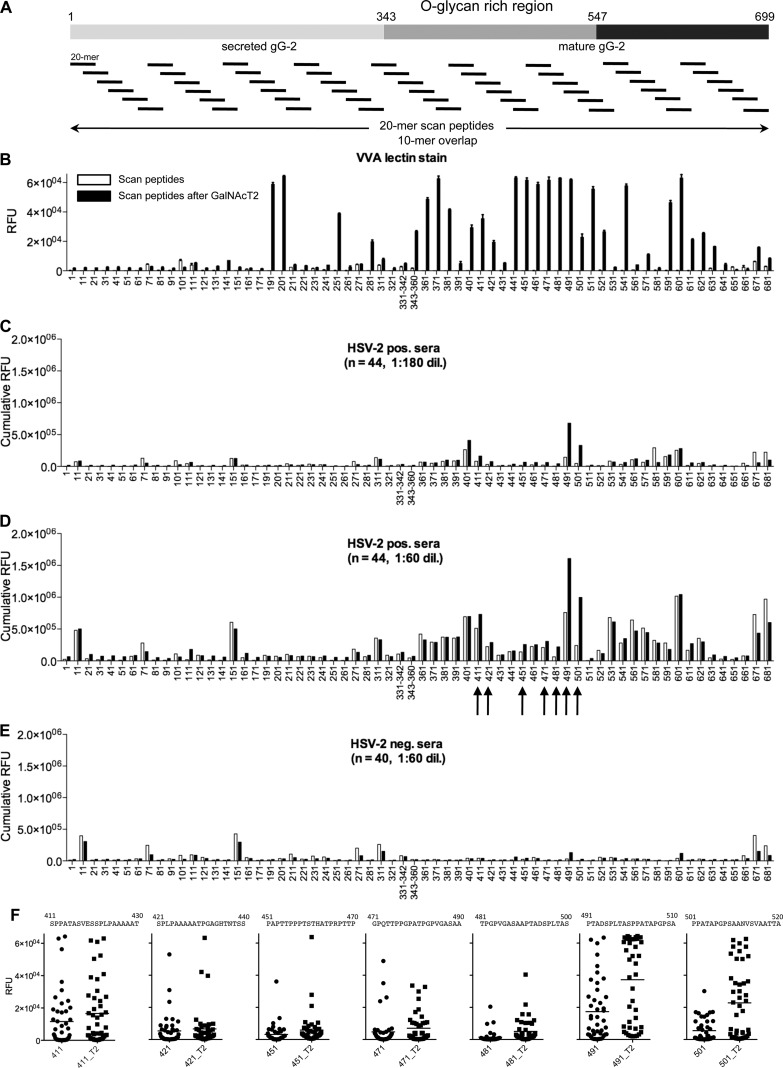
Fig 1.
Chemoenzymatic on-slide glycosylation of gG-2 protein scan peptides with recombinant GalNAc-T2 (synthetic strategy 1). (A) Schematic representation of the whole gG-2 protein (with the O-glycan-rich region, amino acids 343 to 547, within the mature gG-2 protein highlighted) and of the design of the synthetic 20-mer peptides, with a 10-mer overlap, spanning across the protein. (B) VVA lectin staining (5 μg/ml) results before (white columns) and after (black columns) on-chip enzymatic glycosylation. (C and D) Cumulative RFU results of staining of 44 HSV-2-positive sera (HSV-2 positive, n = 22; HSV-1/-2 positive, n = 22) at 1:180 (C) and 1:60 (D) dilutions before (white columns) and after (black columns) on-chip enzymatic glycosylation. (E) Cumulative RFU results of staining of 40 HSV-2-negative sera (HSV-1 positive, n = 20; HSV-1/-2 negative, n = 20) at a 1:60 dilution before (white columns) and after (black columns) on-chip enzymatic glycosylation. (F) Dot plots of selected scan peptides from panel D (highlighted by black arrows) that show increments of cumulative RFU after on-chip GalNAc-T2 (T2) glycosylation relative to the values for the naked peptide. Only scan peptides containing Ser and/or Thr were included on the microarray. The microarray data used for each scan peptide are the averages of four replicates. The error bars in panel B are the standard deviations. See also Table S2 in the supplemental material.

