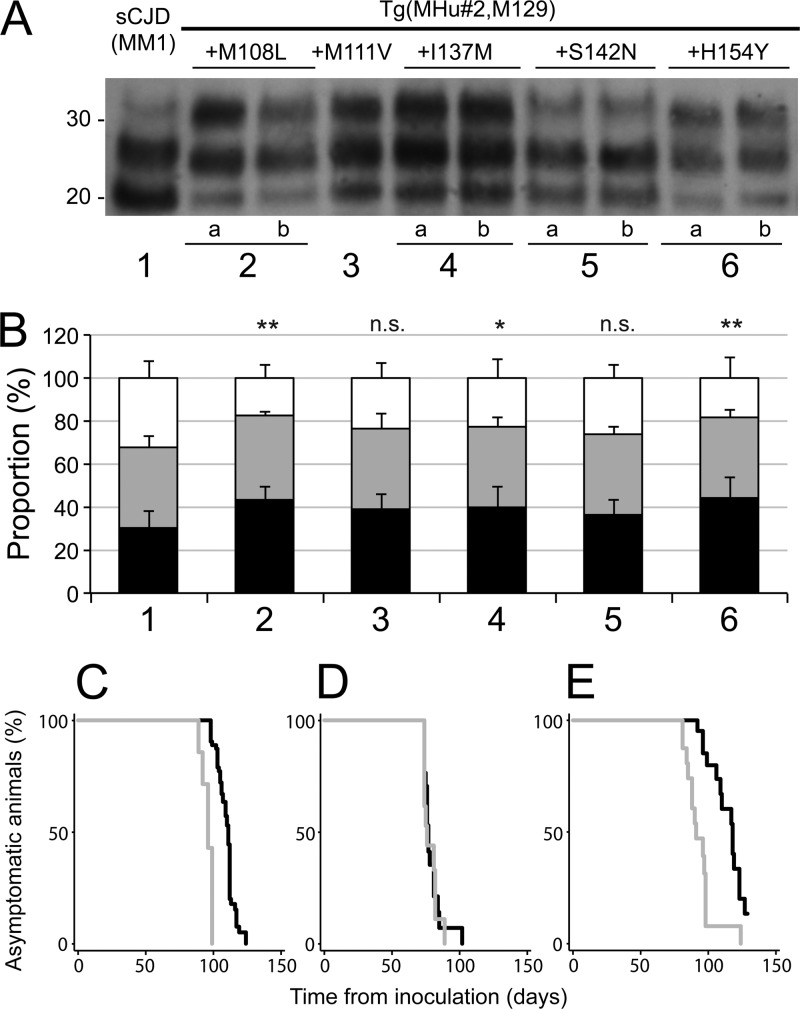
Fig 5.
Passage of sCJD(MM1) prions to Tg mice expressing MHu#2(M129) and an additional reversion to the HuPrP sequence. (A) Immunoblot of brain homogenates: lane 1, inoculum; lane 2a, Tg1208 mice expressing MHu#2(M129,M108L); lane 2b, Tg1284 mice expressing MHu#2(M129,M108L); lane 3, Tg1014 expressing MHu#2(M129,M111V); lane 4a, Tg10027 expressing MHu#2(M129,I137M); lane 4b, Tg10025 expressing MHu#2(M129,I137M); lane 5a, Tg3018 expressing MHu#2(M129,S142N); lane 5b, Tg3061 expressing MHu#2(M129,S142N); lane 6a, Tg4561 expressing MHu#2(M129,H154Y); and lane 6b, Tg5099 expressing MHu#2(M129,H154Y). Samples were treated with 100 μg/ml of PK for 1 h at 37°C prior to loading on gels and probed with the anti-PrP HuM-P antibody. Apparent molecular masses of migrated protein standards are shown in kilodaltons. (B) Proportions of unglycosylated (black), monoglycosylated (gray), and diglycosylated PK-resistant PrP for each construct from multiple repetitions: 1, sCJD(MM1) (1 sample; 18 replicates); 2, MHu#2(M129,M108L) (4 samples; 10 replicates); 3, MHu#2(M129,M111V) (4 samples; 8 total replicates); 4, MHu#2(M129,I137M) (8 samples; 17 total replicates); 5, MHu#2(M129,S142N) (8 samples; 17 total replicates); and 6, MHu#2(M129,H154Y) (8 samples; 15 total replicates). Bars represent means, and error bars represent standard deviations; statistical difference from inoculum (lane 1) indicated above each bar: n.s., not significant; *, P < 0.05; **, P < 0.01. (C to E) Kaplan-Meier survival curves for first (black) and second (gray) passages of sCJD(MM1) prions in Tg(MHu#2,M129)22372 (C), Tg(MHu#2,M129,M111V)1014 (D), and Tg(MHu#2,M129,S142N)3018 (E) mice.

