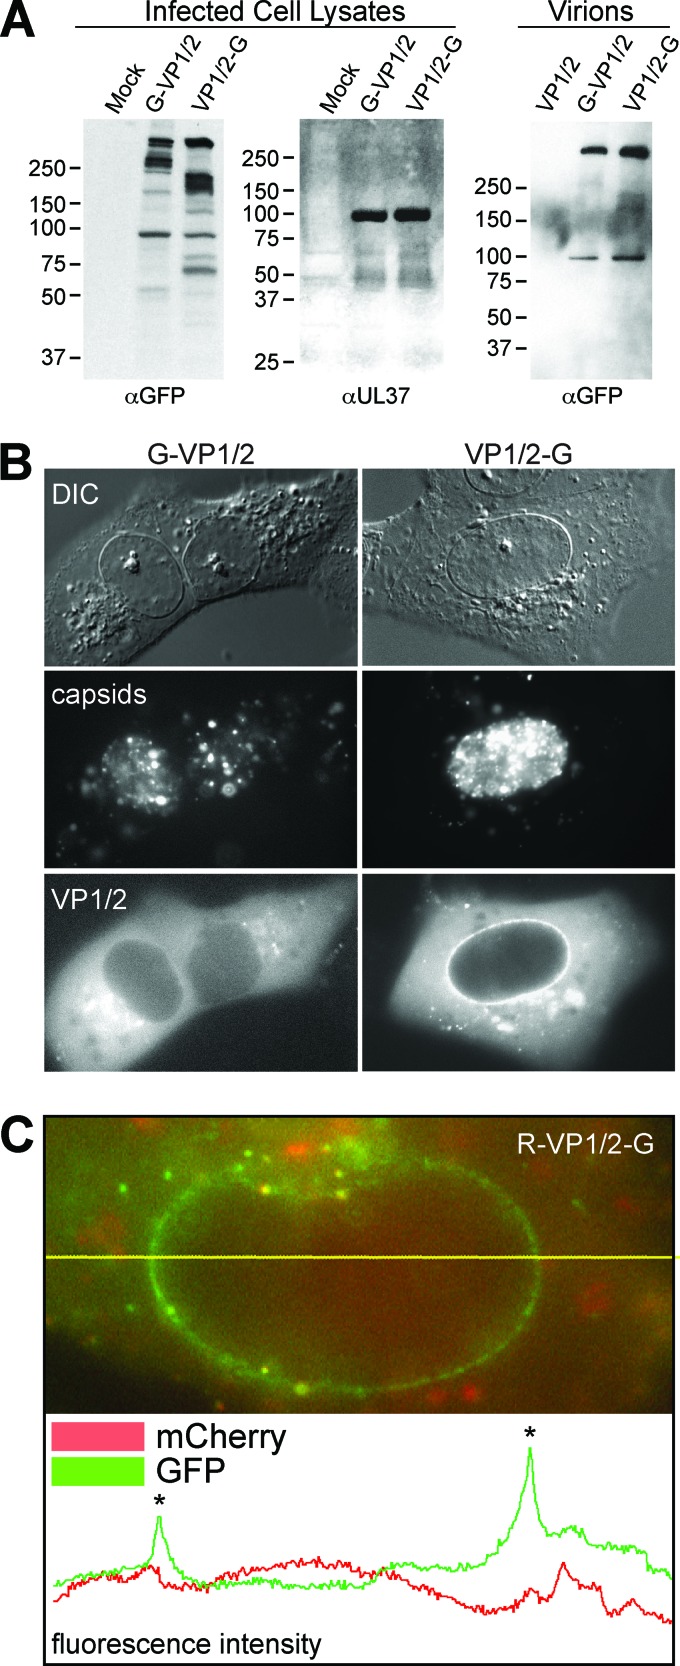
Fig 2.
Distinct profiles of VP1/2 amino- and carboxyl-terminal GFP fusions. (A) Western blots of total cell lysates from Vero cells infected with PRV-GS909 (G-VP1/2) or PRV-GS1903 (VP1/2-G) were probed with an antibody directed against GFP. An antiserum directed against virally encoded pUL37 served as a loading control. Extracellular virions were probed to document the size of structurally incorporated VP1/2. Molecular size markers (in kDa) are indicated to the left of each blot. (B) Representative fluorescence images of live Vero cells infected with either PRV-GS909 (G-VP1/2) or PRV-GS1903 (VP1/2-G) at 7 to 8 hpi. Capsids and VP1/2 were imaged by the intrinsic fluorescence from the fusion proteins encoded by the viruses. DIC, differential interference contrast. (C) Example of a fluorescence profile from a live Vero cell nucleus following infection with PRV-GS1919 (R-VP1/2-G). The image is a color merge of GFP and mCherry (RFP) emissions. The yellow horizontal line overlaid on the image indicates a line scan used to measure pixel intensity values that are plotted below the image. Asterisks on the plot mark pixels intersecting the nuclear envelope.

