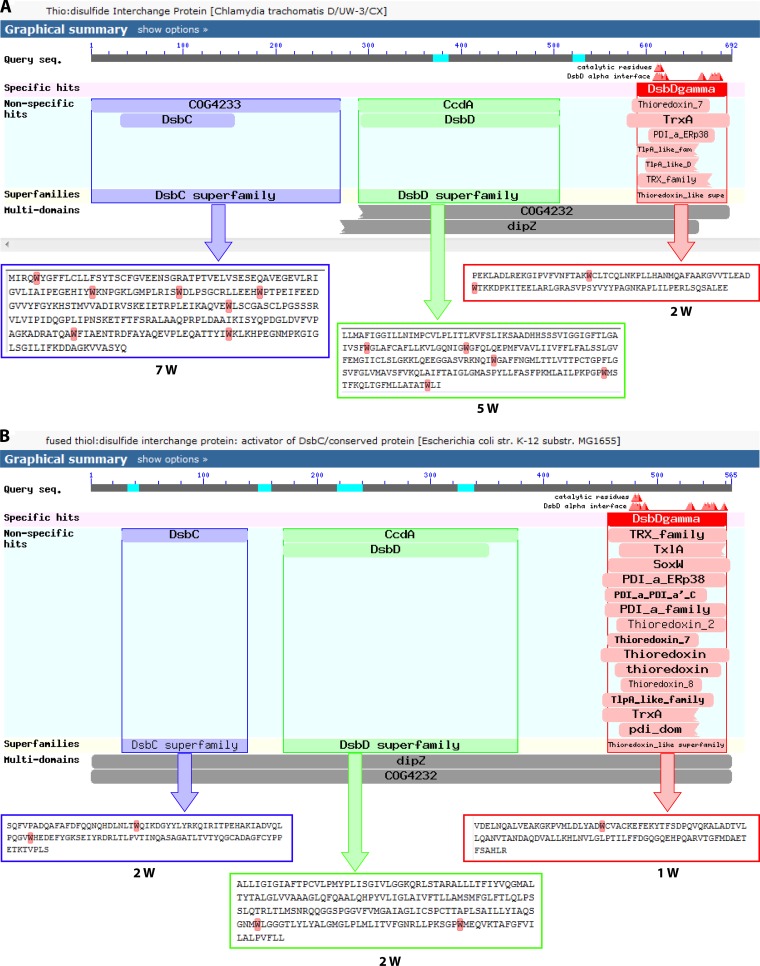
Fig 12.
Screen shots of the cdd graphics obtained when the thio:disulfide interchange proteins from C. trachomatis (top panel) and E. coli (bottom panel) are used as BLAST queries at the NCBI database. The portions of the sequences corresponding to each of the three motif regions are given within color-coded boxes, with Trp residues highlighted.

