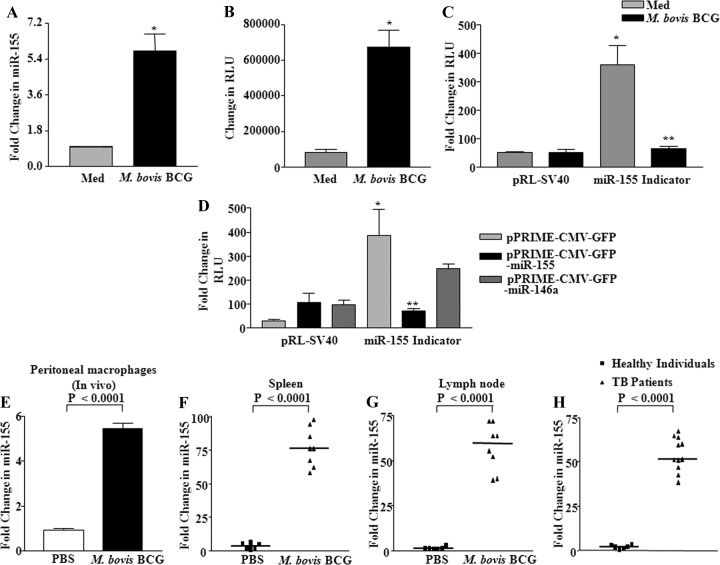
Fig 1.
M. bovis BCG induces upregulation of miR-155 expression. (A) Mouse peritoneal macrophages were infected with M. bovis BCG, and expression of miR-155 was assayed by real-time quantitative RT-PCR. (B) miR-155 promoter activity was measured by transient transfection of RAW 264.7 macrophages with miR-155 promoter-luciferase construct prior to the addition of M. bovis BCG stimulation (data are means ± SE, n = 3). (C) Macrophages were transfected with miR-155 indicator or renilla plasmid (pRL-SV40) prior to M. bovis BCG infection. The luciferase activity of miR-155 indicator was assayed. Data are means ± SE, n = 3. (D) Macrophages were cotransfected with the control vector alone (pPRIME-CMV-GFP) or miR-155 (pPRIME-CMV-GFP-miR-155) or pPRIME-CMV-GFP-miR-146a overexpression plasmids along with the miR-155 indicator construct. The luciferase assay was performed 48 h posttransfection. Data are means ± SE, n = 3. (E) C57BL/6 mice were intraperitoneally infected with 106 M. bovis BCG bacilli for 12 h, while control mice were injected with PBS. Macrophages were harvested, and total RNA was isolated to estimate the total expression level of miR-155 (data are means ± SE; n = 8 for PBS-injected mice, and n = 8 for M. bovis BCG-infected mice). (F and G) In vivo expression of miR-155 was analyzed by injecting M. bovis BCG or PBS as vehicle control into the tail vein of mice. On the seventh day, mice were sacrificed and spleen (F) and lymph nodes (G) were removed for expression analysis of miR-155 (data are means ± SE; n = 6 for PBS-injected mice, and n = 8 for M. bovis BCG-infected mice). (H) Comparison of miR-155 expression profiles in PBMCs from pulmonary tuberculosis patients and from healthy individuals as assayed by real-time quantitative RT-PCR. (data are means ± SE; n = 6 for healthy individuals, and n = 11 for TB patients). Med, medium; *, P < 0.05 versus control; **, P < 0.05 versus miR-155 indicator control.

