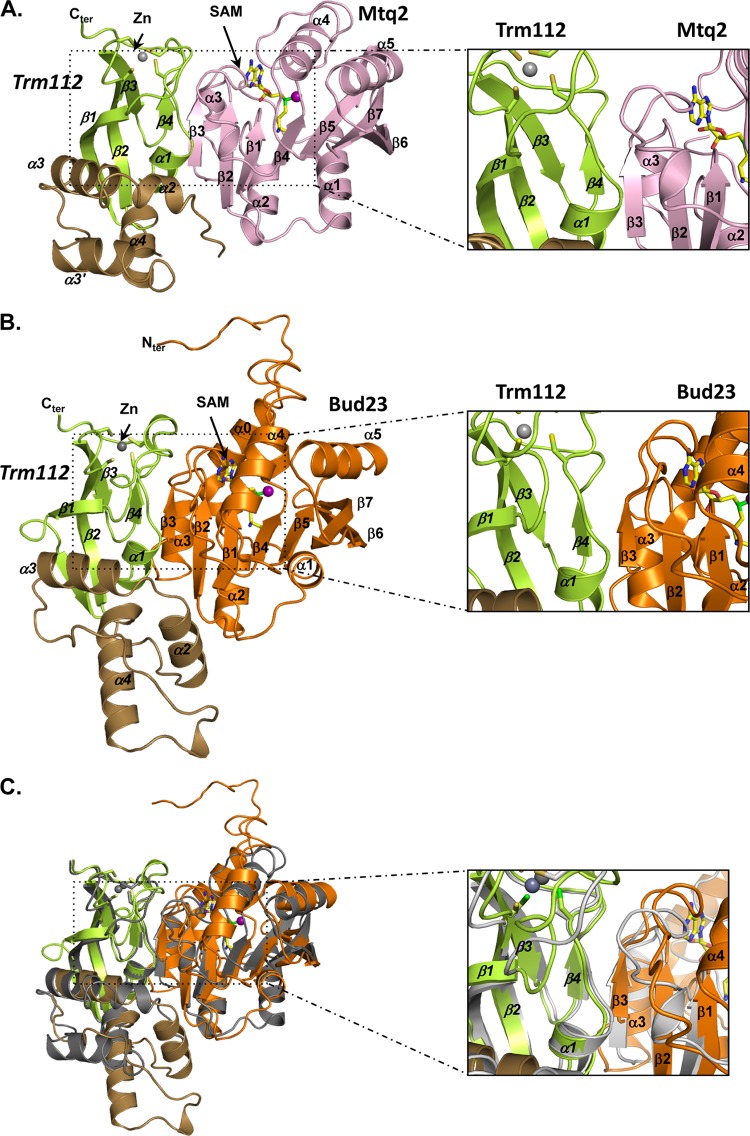
Fig 9.
Trm112 interaction with MTases. (A) Ribbon representation of the E. cuniculi Mtq2 (pink)-Trm112 complex. The Trm112 zinc-binding and central domains are shown in green and brown, respectively. The zinc atom is shown as a gray sphere. The SAM cofactor is depicted in sticks and its methyl group by a purple sphere. Inset to the right, enlarged view of the structural elements at the interface. (B) Ribbon representation of the S. cerevisiae Bud23 (orange)-Trm112 complex model. The Trm112 color code and orientation are the same as in panel A. The secondary structure elements predicted for Bud23 are indicated. (C) Overlay of the Mtq2-Trm112 complex structure (gray) and Bud23-Trm112 complex model (same color code as in panel B).

