
Figure 13.
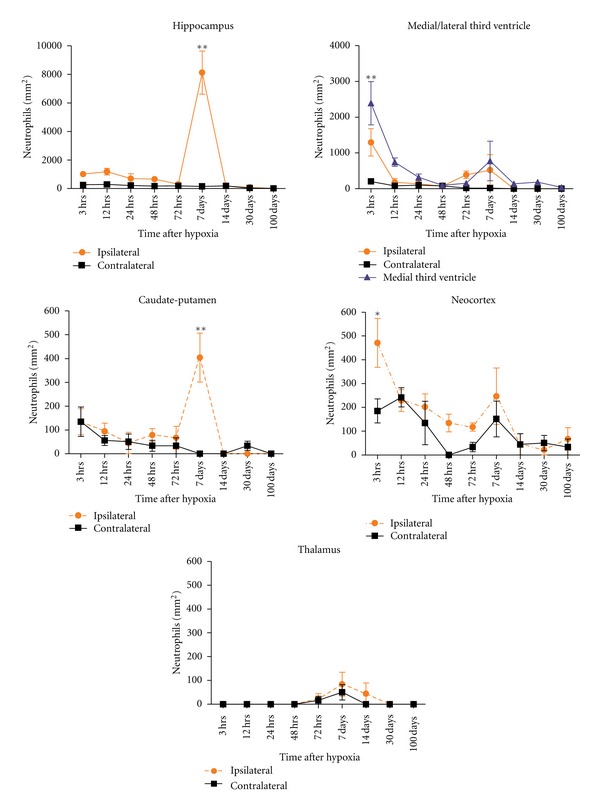
Neutrophils quantification is done using image J software (NIH) and is evaluated at 3–72 hours and 7–100 days. The regions analysed were the hippocampus, medial/lateral third ventricle, caudate-putamen, neocortex, and thalamus. The quantity in the ipsilateral side is compared to the contralateral hemisphere. Significant changes are observed in the ipsilateral side of the hippocampus and caudate-putamen at 7 days after hypoxia while a decrease in number is observed after 3 hours in the ventricles and neocortex. There is no change in the thalamus. All values are represented as mean ± S.E.M and are corrected using Abercrombie correction method. Two-way ANOVA with Bonferroni post-hoc analysis is used to compare ipsilateral versus contralateral hemisphere at all time points and *P < 0.01, **P < 0.001 was considered significant.