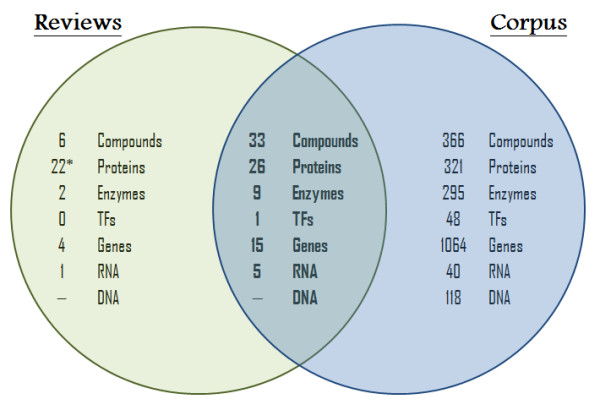
Figure 4.

Venn diagram comparing annotations from corpus and selected reviews. This diagram indicates the number of biological concepts per class that represent the corpus and from the latest reviews considered to be relevant to this subject. The intersecting zone gives the number of biological concepts that were simultaneously reported in the two set of documents.
