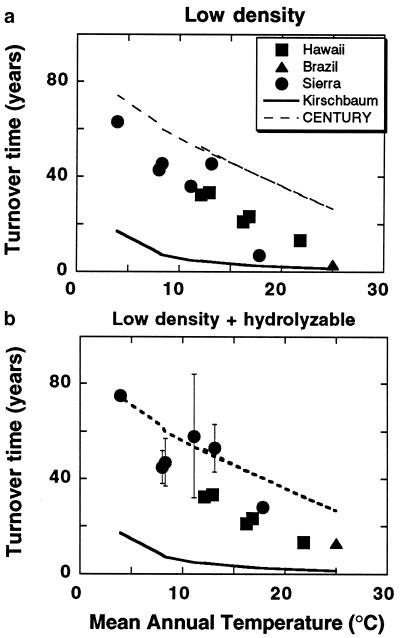
Figure 4.
Turnover times for fast-cycling fractions for a number of sites plotted against mean annual temperature: (a) low-density C in the Sierra Nevada transect (3); combined active plus slow C from the Hawaii temperature transect (5); low-density C from a mature seasonal tropical forest in eastern Amazonia (60); (b) using low-density plus hydrolyzable carbon for Sierra and Brazil sites. All data represent approximately the upper 20 cm of soil. Also shown are predicted turnover time-temperature relationships estimated from the century model and from the literature review of Kirschbaum (51). The century curve is based on model results reported in Schimel et al. (12) assuming the temperature dependence reported in that paper, and combining pools assuming 5% of the C to 0–20 cm is contained microbial biomass pool, 20% in the detrital pool, and 50% in the slow pool.

