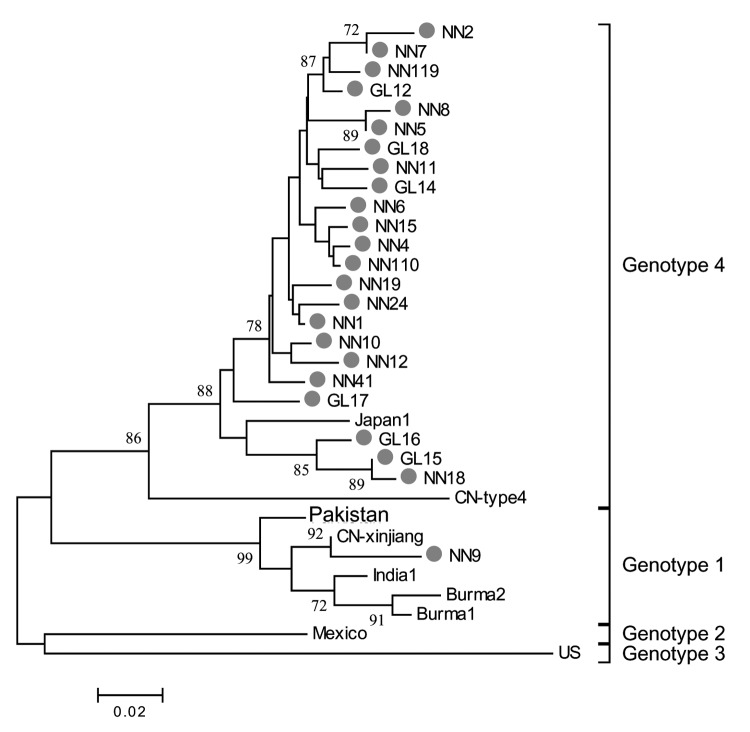
Figure 3.
Phylogenetic analysis of hepatitis E virus (HEV) isolates. HEV isolates from patients with serologically diagnosed hepatitis E cases admitted in 2003 and 2004 to local hospitals are represented by closed circles. Prototype strains of indicated genotypes are designated according to site of isolation. Numbers on the branches represent (percent) reproduced values calculated from 1,000 resamplings of the data. The bar represents a genetic distance of 0.02-nt substitution per position.

