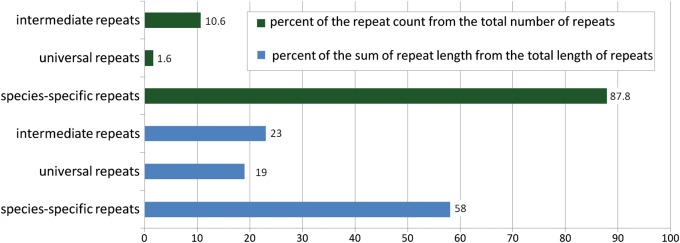
Figure 3.
The frequencies of repeats considered in this study. The first three columns represent the percentage of the number of particular repeats from the total number of repeats found in this work. The second three columns show the percentage of repeats in nucleotides from the total length of repeats found in this work. This figure can be viewed in colour online.

