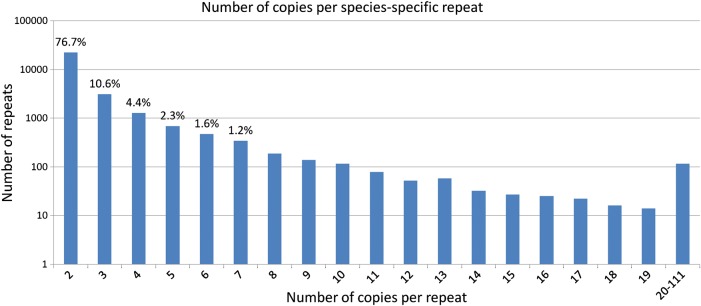
Figure 5.
The distribution of the number of copies per species-specific repeat. Although the number of copies per species-specific repeat in different species varies, the median value (rounded down to the nearest integer) over the number of copies per particular repeat is considered. The number above the column shows the percentage of prevalence of particular number of copies per repeat from the total number of repeats. Only the values over 1% are shown. y-axis is on a logarithmic scale.

