Figure 6.

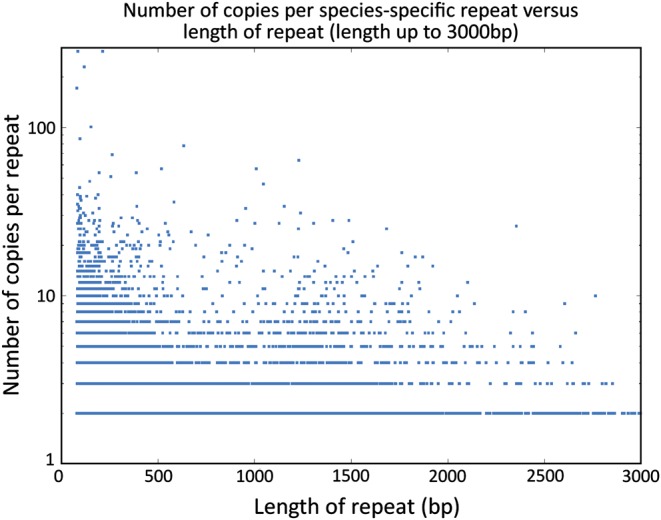
Correlation between the length of species-specific repeat and the number of copies per species-specific repeat. Only repeats up to 3000 nucleotides are shown. y-axis is on a logarithmic scale.

Correlation between the length of species-specific repeat and the number of copies per species-specific repeat. Only repeats up to 3000 nucleotides are shown. y-axis is on a logarithmic scale.