
Figure 4.
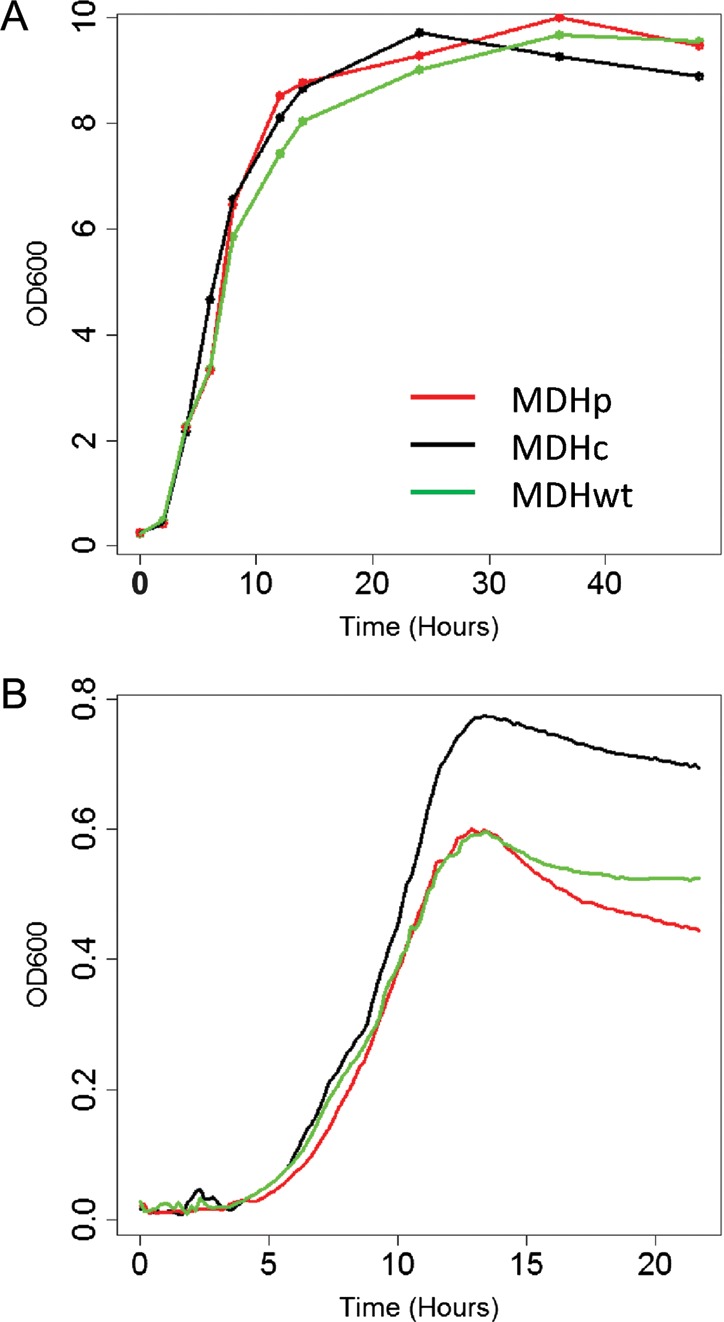
Comparative growth of YlMDH2 mutants. (A) Growth curves in flasks with agitation in YNBE medium with glucose 2%. (B) Growth curves on 96-well plates in YNBE with glucose 0.5%. Coloured curves represent the different splicing mutants of YlMDH2: the cytosolic form is in black (MDHc), the peroxisomal form is in red (MDHp) and the wild-type is in green (MDHwt). OD, optical density measured at 600 nm.