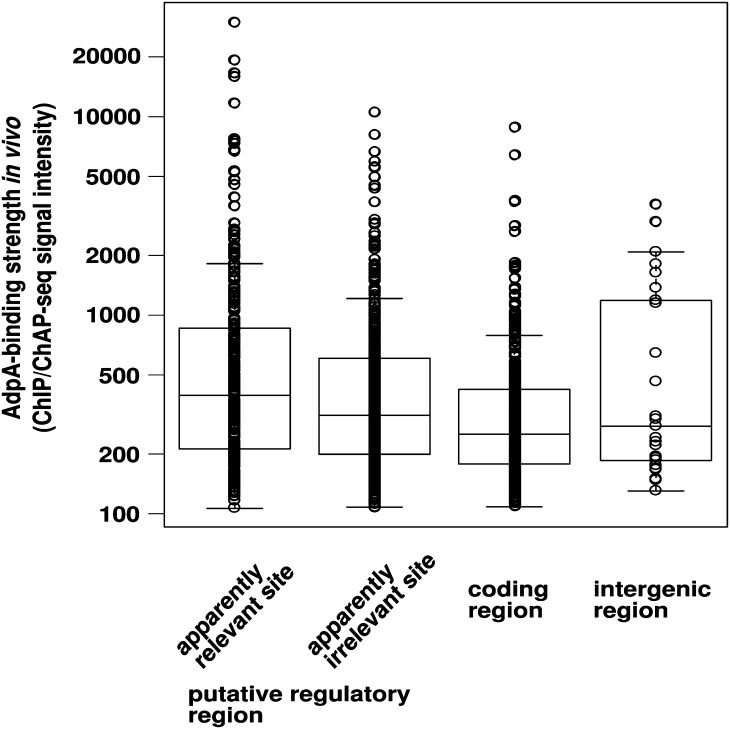
Figure 4.
In vivo AdpA-binding strength is not related to the functional significance of particular AdpA-binding sites. One-dimensional scatter plots of AdpA-binding strength in vivo are shown for four respective classifications of AdpA-binding sites. The means of peak signals derived from ChIP-seq and ChAP-seq are plotted. Box plots are also shown. In the box plot, the bottom and top of the box are the 25th and 75th percentile (the lower and upper quartiles), respectively, and the band near the middle of the box is the 50th percentile (the median). The ends of the whiskers represent the lowest datum still within 1.5 IQR of the lower quartile, and the highest datum still within 1.5 IQR of the upper quartile (IQR, inter-quartile range, is equal to the difference between the upper and lower quartiles).

