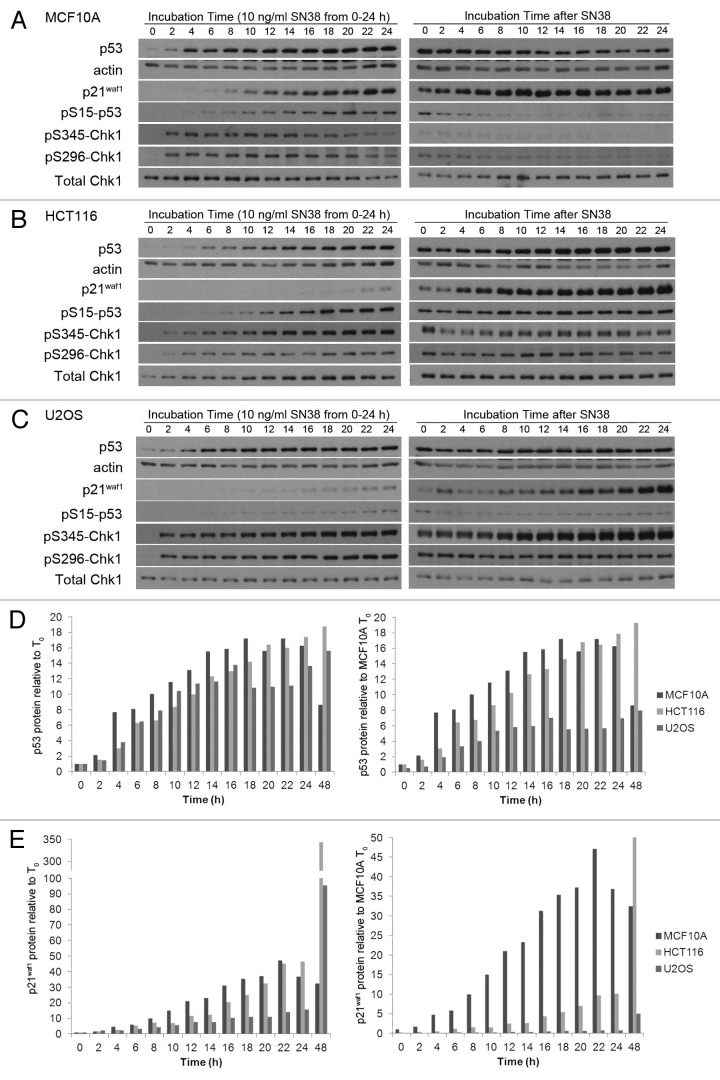
Figure 3. Kinetics of p53 and p21waf1 protein expression following SN38 treatment. (A) MCF10A, (B) HCT116 and (C) U2OS cells were incubated with 10 ng/ml SN38 from 0–24 h. The drug was removed and cells incubated for an additional 24 h in fresh medium. Cells were harvested at the indicated times and proteins detected by western blotting. (D) p53 and (e) p21waf1 protein levels were quantified by densitometry of multiple exposures of western blots and from comparison to a standard curve generated for each antigen. The left panels show protein induction compared with the untreated control of each cell line. The right panels show protein induction compared with the level in untreated MCF10A cells.

An official website of the United States government
Here's how you know
Official websites use .gov
A
.gov website belongs to an official
government organization in the United States.
Secure .gov websites use HTTPS
A lock (
) or https:// means you've safely
connected to the .gov website. Share sensitive
information only on official, secure websites.
