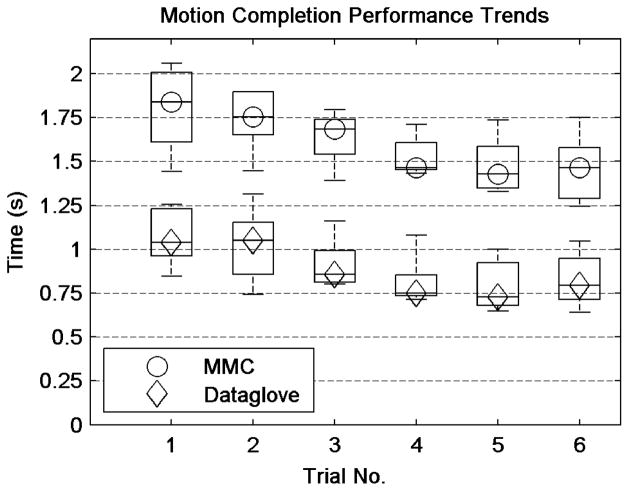
Fig. 4.
Plot of average motion completion times for each subject for each of six trials. The central mark for each box denotes the median motion completion time and each box encompasses the 25th to 75th percentiles for that trial and control methodology. Whiskers extend to the maximum and minimum times recorded.

