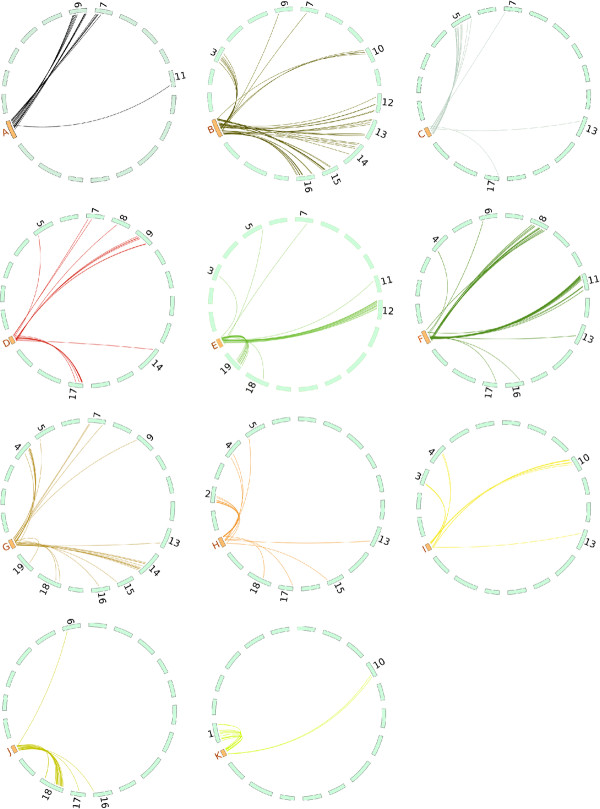
Figure 2.
Macrosyntenic relationships between each of the 11 coffee tree Linkage Groups and the 19 grapevine pseudo-chromosomes based on in silico mapping of mapped coffee COSII genes. The coffee tree linkage groups (identified by letters) are represented in orange and the 19 grapevine pseudo-chromosomes are represented in blue. Each line links the position of a unique orthologous COSII gene between coffee linkage groups and grapevine chromosomes identified by BLAST searches as described in Materials and Methods.

