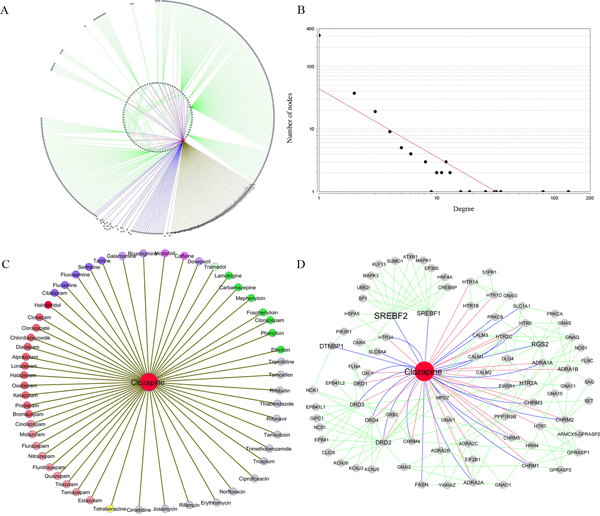
Figure 4.
Clozapine-target interactome network and its network characteristics. A) Graphical representation of the clozapine-target interactome network. B) Degree distribution of all nodes (drugs, targets, genes, and proteins) in the clozapine-target interactome. The Y-axis represents the number of nodes with a specific degree. C) Graphical representation of clozapine adverse interaction drugs. According to Anatomical Therapeutic Chemical (ATC) classification systems, the nodes in different colors represent drugs belonging to the "nervous system" at the fourth level: N02A (light green), N03A (green), N05A (dark red), N05B (red), N05C (light red), N06A (purple), N06B (light purple), N06D (dark purple), and N07X (yellow). Nodes in grey with brackets represent drugs related to the "antiinfective for systemic use". Other nodes in grey represent drugs belonging to other categories with exception of above two categories. D) Graphical representation of clozapine-target interactions after removing the nodes with degree 1 and other drug nodes. An edge in red represents the relationship between clozapine and a target, an edge in blue represents the relationship between clozapine and an associated gene, and an edge in green represents the interaction between a target/gene and a protein from protein-protein interaction (PPI) data.

