
Figure 6. The C- and R-spine regions of PknBSA-KD.
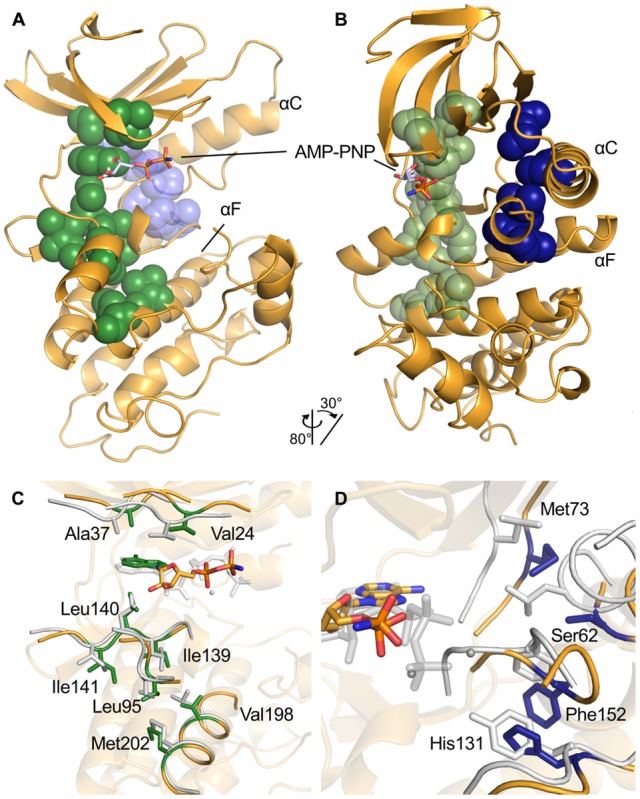
(A, B). Overview of the location of the two spines in PknBSA-KD. The C-spine is colored in green, the R-spine in the background in blue. The two views differ by the indicated rotation to provide a better view of the orientation and location of the R-spine. (C). Detailed view of the residues belonging to the C-spine of PknBSA-KD and the adenine of AMP-PNP as part of the spine are shown in green. The residues of the C-spine of PKA in a closed state (PDB ID: 1ATP [35]) are shown for comparison. (D). Detailed view of the R-spine residues of PknBSA-KD in blue. Corresponding residues of PKA are shown in grey. While the spine is formed in PKA, it is interrupted by the Ser62 and placed away from ideal position in PknBSA-KD. The structure of PKA in panels C and D was aligned with PknBSA-KD C-lobe residues 100–250.