
Figure 7. Analysis of conservation of PknB residues.
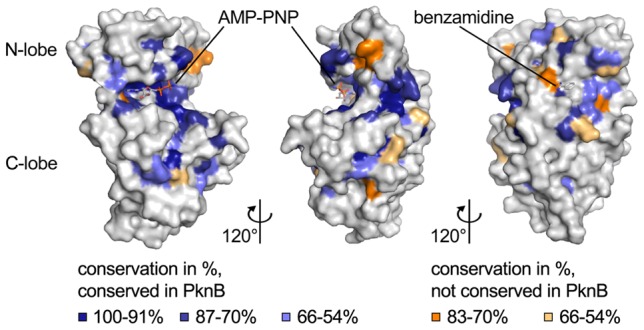
Surface representation of PknBSA-KD. The three views differ by rotations of 120° and 240°, respectively, around a vertical axis. The coloring is based on an alignment of 24 bacterial STKs (Fig. S6). Blue indicates highly conserved residues (100–91% conservation in dark blue, 87–70% conservation in blue, and 66–54% light blue). Residues that are highly conserved in most kinases but are different in PknBSA-KD are colored in orange (83–70% conservation in orange, 66–54% conservation in light orange). In the right panel, the benzamidine bound to PknBSA-KD in three of the six chains of the asymmetric unit is shown as a stick model. The benzamidine is not visible in the other two panels.