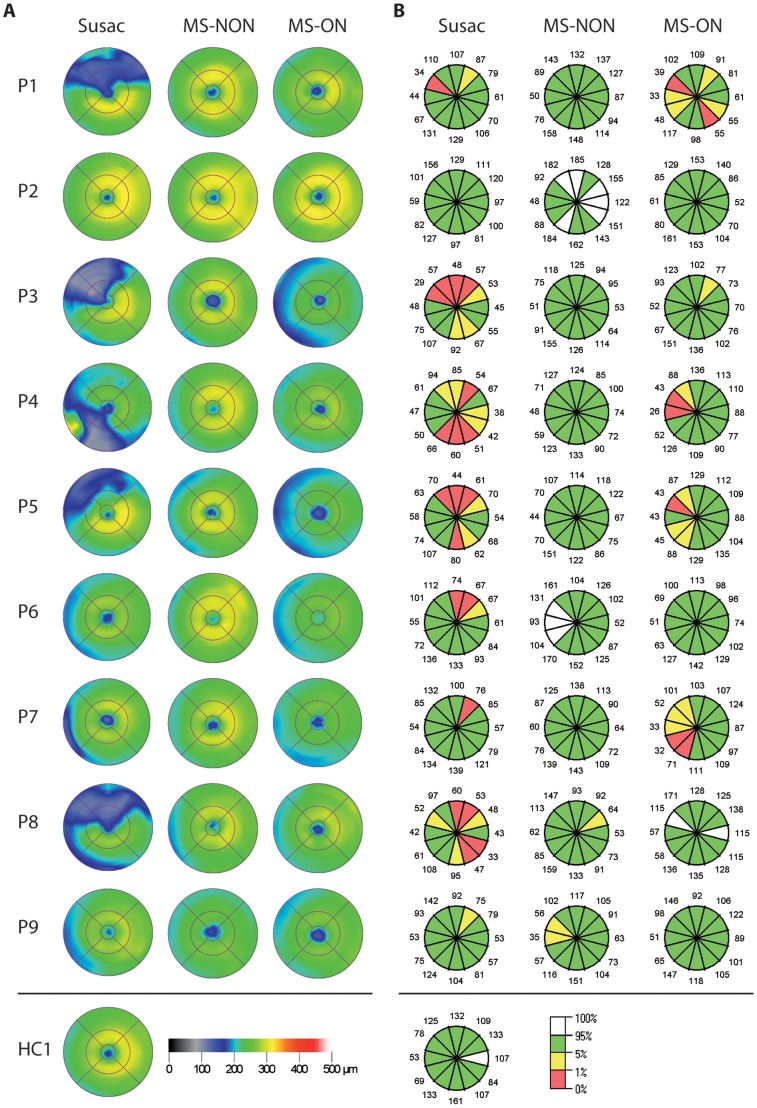
Figure 1. Macular and ring scans from patients with Susac syndrome and matched RRMS patients.
Shown are only the left eyes (randomly selected to save space) from each Susac patient (P1-9) and the corresponding left eyes from RRMS patients without history of optic neuritis (MS-NON) and RRMS patients with history of optic neuritis (MS-ON). On the bottom, a comparison of scans from one of the healthy controls is given. A) Colour coded is the calculated macular thickness from the device's segmentation algorithm with black to blue for reduced thickness and yellow to green for normal thickness (left legend on the bottom). The macular thickness map is calculated from six linear scans through the centre of the macula. Of note is the different distribution of the damage. B) For RNFLT scans, the thickness from 12 clock-hour segments of the circular scan is given. Colour coded is the thickness relative to the normative database with green and white meaning normal values above the 5th or 95th percentile and yellow and red meaning reduction of thickness below the 5th or 1st percentile (right legend on the bottom). Whereas some Susac patients' eyes show striking sectoral damage, eyes from RRMS patients show an even thinning with an accentuation in the outer temporal areas, that is further pronounced with a history of optic neuritis. Three Susac patients (P6, 7, 9) show a similar pattern.

